
Large-scale renewable electricity
Insights
- Renewables reached a new Q1 high share of National Electricity Market output at 47%, as reported by the Australian Energy Market Operator (AEMO), continuing the structural shift in the generation mix driven by growth in wind and solar and a sustained decline in thermal generation.
- These generation outcomes reflect a system increasingly able to accommodate higher renewable penetration, with lower reliance on coal and gas‑fired generation at peak demand times.
- Small and large-scale battery storage is playing an increasingly significant role in supporting these outcomes, helping absorb surplus renewable generation and supply energy during periods of higher system demand.
- Sustained growth in renewable generation contributed to continued oversupply in the large‑scale generation certificate (LGC) market, placing further downward pressure on LGC prices through Q1 2026.
- Oversupply was driven by record renewable generation, with LGC creations reaching an all-time high and prices declining further, from $6.25 to $2.90 over the quarter.
- Non-RET demand for LGCs reached a new Q1 high, driven by non government voluntary cancellations, with demand expected to remain elevated in the near term.
- Market-based accounting for scope 2 emissions, including amendments to the eligibility of LGCs for reducing scope 2 emissions introduced in 2025, may further support non-government voluntary demand in 2026 and beyond.
- Despite historically low LGC prices, large‑scale investment activity and approvals have remained resilient, reflecting the continued role of power purchase agreements (PPAs) and government schemes in supporting project viability.
- Investment resilience reflects widespread use of long term PPAs and other support mechanisms that hedge electricity prices and limit exposure to low LGC prices.
- Smaller scale and commercial projects, with fewer hedging options and limited alternative support, may be more exposed to sustained low prices.
- Early‑year final investment decisions (FID) were strong, with 946 MW of large‑scale generation capacity reaching this milestone in Q1 2026. Since the end of Q1, additional projects have reached FID, lifting the year to date total to around 2.4 GW. This already exceeds total FID in 2025 (2.1 GW).
- Together with the progression of Capacity Investment Scheme (CIS) projects, this points to a potentially robust investment pipeline for 2026, noting that final investment decision activity is inherently lumpy and uncertain.
- Alongside record voluntary Q1 demand for LGCs, Q1 2026 saw the first creation of Renewable Electricity Guarantee of Origin certificates, signalling the emergence of new market‑based mechanisms as the Large‑scale Renewable Energy Target system approaches completion.
On this page
- Market dynamics
- Healthy Q1 for large-scale approvals
- A robust start to 2026 final investment decisions
- Strongest Q1 on record for non-RET surrenders
- First REGO certificates created
Market dynamics
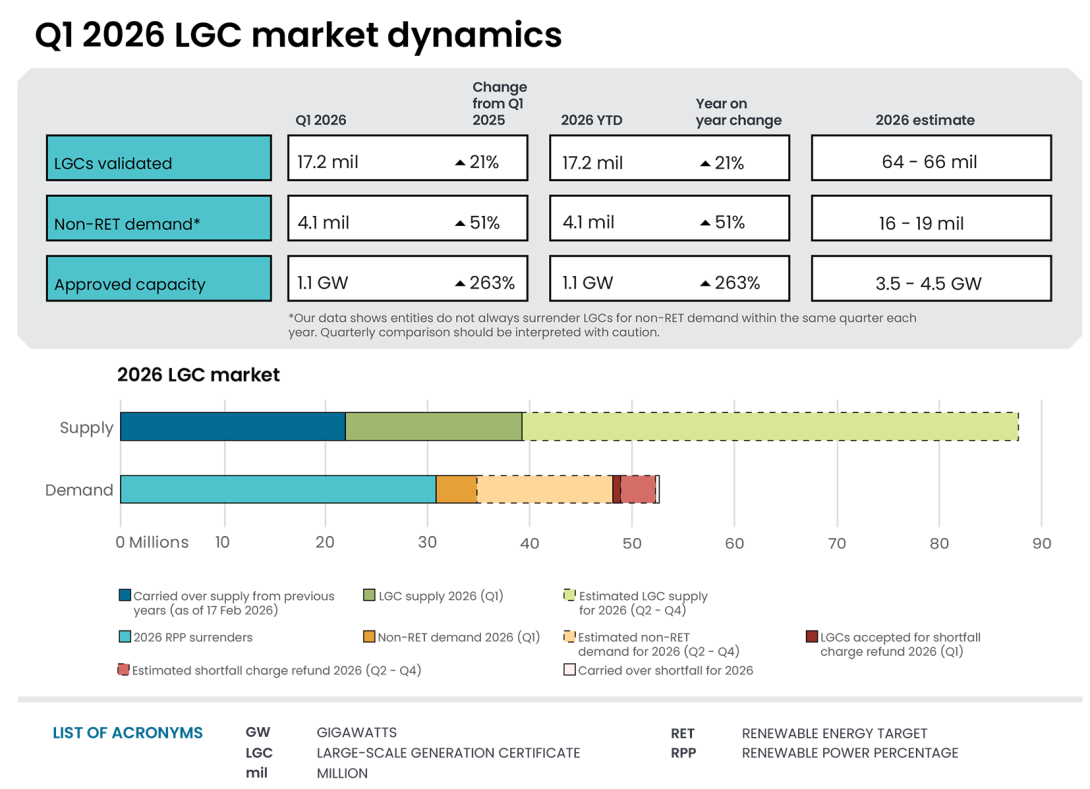
| Supply | Demand | |
|---|---|---|
| Supply carried over from previous years (as of 17 Feb 2026) | 22.2 m | - |
| LGC supply (Q1 2026) | 17.2 m | - |
| Estimated LGC supply (Q2 - Q4 2026) | 46.8 m to 48.8 m | - |
| Non-RET demand (Q1 2026) | - | 4.1 m |
| Estimated non-RET demand (Q2 - Q4 2026) | - | 11.9 m to 14.9 m |
| 2026 RPP surrenders (before any shortfall) | - | 30.7 m |
| LGCs accepted for shortfall charge refund (Q1 2026) | - | 0.9 m |
| Estimated shortfall charge refund (Q2 - Q4 2026) | - | 2.9 m |
| Carried over shortfall for 2026 (less than 10% of liability) | - | 0.2 m |
| Estimated balance as of 16 Feb 2027^ | 32.5 m to 37.5 m | |
Notes:
- There is a total of 5.7 million LGCs in shortfall that are eligible for shortfall refunds to be claimed, representing $368.7 million in consolidated revenue as of 31 March 2026. This excludes LGCs in shortfall from entities under administration.
- ^Sum of all supply items, less the sum of all demand items. This assumes no further shortfall is taken for the 2026 compliance year. Figures may not sum due to rounding.
LGC creations are driven by the generation of renewable electricity by accredited large-scale power stations. One LGC is created for each MWh of eligible renewable electricity. Generation by power stations depends on installed capacity, weather, and operational factors like repairs, maintenance, and curtailment.
A record 17.2 million LGCs were created in Q1 2026, up 21% from Q1 2025 with 14.2 million LGCs. Growth was driven by higher creations from both wind and solar. Wind LGC creations totalled 9.6 million in Q1 2026, representing a 30% increase from Q1 2025, while solar accounted for over 6.8 million, up 16%. Declines in LGC creations for biomass and hydroelectricity had limited impact on the overall supply of LGCs due to their small share.
According to Australian Energy Market Operator’s (AEMO) Quarterly Energy Dynamics Q1 2026, renewables reached a new Q1 high share of National Electricity Market (NEM) output for the March quarter, driven by robust growth in wind and solar generation. Grid-scale solar generation increased to a new quarterly high of 2.7 GW, up 13% from Q1 2025, while wind generation also reached a new Q1 high, rising by more than 9% to an average of 3.8 GW, supported by increased availability at new and commissioning facilities, particularly in Queensland.
In contrast, thermal generation declined over the quarter. Total coal-fired generation fell to a new Q1 low of just over 13.1 GW, down around 4% compared with Q1 2025, with marginal year-on-year growth of around 1% in brown coal-fired generation, offset by a larger decline of more than 6% in black coal-fired generation. Gas-fired generation declined more sharply, falling by 24% to 712 MW, representing its lowest quarterly average since Q4 1999.
These shifts in the generation mix lifted the large and small-scale renewable share of NEM output to a record Q1 level of close to 47% according to AEMO, up from approximately 43% in Q1 2025, and reflecting the continued transition towards lower emission generation sources. This outcome reflects a combination of higher renewable electricity generation and would also incorporate lower grid demand associated with household battery self-consumption.
In parallel with these shifts, battery storage played an increasingly significant role in supporting system outcomes in Q1 2026. AEMO reports that battery discharge in the NEM was around 3 times higher in Q1 2026 compared to Q1 2025, consistent with substantially higher additions of new large-scale battery capacity during the quarter relative to the same period last year. Small-scale batteries also contributed, as households with batteries exported to the grid for longer and reduced grid imports during evening peak hours, reflecting the increasing role of self-consumption of stored electricity to meet peak household load, moderating demand from the grid.
The growing presence of batteries has become an important enabler of higher renewable penetration, smoothing intraday supply–demand balances and supporting the continued transition of the generation mix. AEMO reports that in Q1 2026, combined battery charge and discharge accounted for almost one-third of price-setting dispatch intervals across the NEM, making batteries the most frequent price-setting technology in the quarter. The market operator notes that battery discharge during peak periods contributed to lower peak prices and reduced price volatility across most regions, while increased daytime battery charging also smoothing the ‘duck curve’, contributing to higher daytime prices year-on-year, with lower negative price occurrence.
The Renewable Electricity Guarantee of Origin (REGO) scheme, administered by the CER, recognises the increasing importance of large-scale storage in the electricity system. Energy storage systems can create REGO certificates for the renewable electricity they dispatch. To establish the renewable electricity attribute, storage must match the electricity used to charge the system with surrendered LGCs or retired REGOs or have a direct supply relationship with a renewable electricity generator. Energy storage systems cannot create LGCs under the LRET.
Description
This figure shows the number of LGCs validated by technology type over time.
As discussed in the Q4 2025 QCMR, LGC supply continues to exceed market demand, reflecting sustained growth in renewable generation over the fixed annual target of 33,000 GWh. This year we anticipate an oversupply of between 10.3 and 15.3 million LGCs, even with robust growth in voluntary demand. We expect:
- between 64 and 66 million LGCs will be created in 2026
- total LGC demand of between 50.7 and 53.7 million. A total of 30.7 million LGCs will be required to be surrendered in 2026 to meet the Renewable Power Percentage. We expect that between 16 and 19 million LGCs will be surrendered for non-RET purposes, with a further 4.0 million surrenders expected for 2023 shortfall charge refunds falling due in 2026 and carried over shortfall from 2025.
By comparison, 2025 saw 9.0 million more LGCs created relative to demand in that year, with 59.7 million creations compared to 50.7 million total surrenders. As discussed in previous QCMRs, healthy LGC supply indicates large volumes of renewable energy generation, and the historical success of the Large-scale Renewable Energy Target (LRET) in incentivising investment in large-scale renewable energy.
The ongoing LGC oversupply is continuing to place downward pressure on LGC prices. The LGC spot price declined through Q1 2026, falling from $6.25 at the start of the quarter to $2.90 by the quarter end. The LGC spot price continued to decline post-quarter and sat at $2.40 on 15 May 2026. Since beginning its steady decline at the start of Q4 2024, the LGC spot price has fallen by more than 90%, reflecting continued downward pressure associated with persistent market oversupply. The forward prices across all vintages from 2026 to 2030 followed a similar downward trajectory over the course of Q1 2026.
These market dynamics are occurring alongside the commencement of the REGO scheme, which is expected to play an increasing role in certifying renewable electricity attributes as the LRET concludes. The CER will continue to administer both schemes during the transition period and will monitor emerging market dynamics, including market formation in the new voluntary market.
Large-scale generation certificate (LGC) reported spot and forward prices
Note: This figure is not interactive.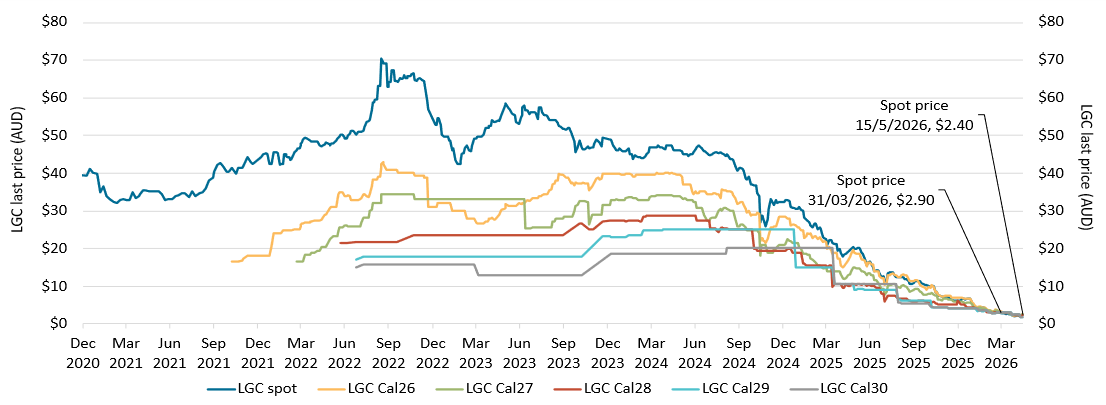
Description
This figure shows the daily closing LGC spot price and calendar year forward prices over time.
Small print
For example, Cal26 is the 2026 calendar year, where an agreement is made to buy/sell LGCs at a specified price in 2026. Pricing data is compiled from trades reported by CORE markets and may not be comprehensive. Prices are shown from 31 December 2020 to 15 May 2026.
Healthy Q1 for large-scale approvals
Approvals in Q1 2026 were strong. As of 31 March 2026, 1.1 GW of capacity was approved to generate LGCs under the LRET. Another 0.5 GW of large-scale capacity remains under assessment as of 31 March 2026. While approvals were strong in Q1 2026, large-scale project approvals are typically volatile from quarter to quarter and strong outcomes in a single quarter are not necessarily indicative of full-year performance. We will monitor approval activity throughout the year and provide updates to our annual approval projection of around 3.5 to 4.5 GW in future QCMRs. This is broadly similar to expected new small-scale generation capacity of 3.0 to 3.7 GW, with indicators at this stage suggesting a strong annual result (see Chapter 3).
Capacity contributions from wind and solar were broadly balanced in Q1 2026. Solar projects accounted for around 0.5 GW of approved capacity, while wind projects contributed around 0.6 GW.
Major power stations approved in Q1 2026 include:
- Golden Plains Wind Farm Stage 2 (577 MW, VIC)
- Broadsound Solar Farm (377 MW, QLD).
Description
This figure shows the capacity of large-scale wind and solar power stations approved by the Clean Energy Regulator to generate large-scale generation certificates over time.
Small print
Solar and wind hybrid projects are grouped under the wind category. Totals may not sum due to rounding. Data, including for earlier years, can be found on Large-scale renewable energy data and Historical large-scale renewable energy supply data.
A robust start to 2026 final investment decisions
Large-scale investment activity had a robust start to 2026, with 946 MW large-scale generation capacity reaching final investment decision (FID) in Q1. The investment was broadly distributed across technologies with solar projects accounting for approximately 525 MW of capacity reaching FID and wind projects contributing around 421 MW. Since the end of the quarter, additional projects have announced FID or commenced construction, lifting year‑to‑date FID to around 2.4 GW. This already exceeds total FID recorded in 2025 (2.1 GW), although FID activity is inherently lumpy and year‑to‑date outcomes may not be indicative of how activity evolves over the remainder of the year.
Market analysts have indicated that 2026 could be a more positive year than 2025 for wind, with some expecting improved investment conditions and a pipeline of projects progressing toward commitment. However, the outlook is subject to broader uncertainty, including global geopolitical developments, inflationary pressures, and financing conditions, which may influence the timing and scale of investment decisions.
The CSIRO’s GenCost 2025-26 Draft Report also suggests that onshore wind capital costs are showing tentative signs of stabilising after several years of sharp increases. The easing of cost pressures may improve investment conditions for onshore wind, although cost trends represent only one of several factors influencing final investment decisions. The report finds that combination of solar PV, onshore wind, storage and gas or hydrogen remains the least-cost generation mix for Australia’s electricity system to 2050. This pathway supports the legislated 82% renewables by 2030 target and remains least-cost across a range of 2050 emissions outcomes, including net zero.
Major projects reaching FID in Q1 2026 include:
- Solomon Airport Solar Farm (440 MW, WA)
- Palmer Wind Farm (288 MW, SA)
- Nullagine Wind Farm (133 MW, WA).
Palmer Wind Farm was the fifth generation project supported by the Capacity Investment Scheme (CIS) to reach FID. As of Q1 2026, the CER’s large-scale project pipeline included 13.7 GW of capacity attributed to projects with announced support for either the full project or part of the project under the CIS. Of this capacity, 58 MW has been accredited, and 985 MW has reached FID. This reflects the capacity expected to be accredited under the LRET from these projects if developed and includes generation capacity from hybrid (generation and storage) projects where only the storage component is supported by the CIS.
In December 2025, DCCEEW reported that 22 projects with a combined capacity of 6.5 GW had signed CIS agreements, with a further 41 projects (out of 63, totalling 18.2 GW) subject to ongoing negotiations. DCCEEW indicated that they expect FID for much of this capacity to be announced in 2026, with construction to commence shortly afterwards. The outcome of tenders 5 and 6 were announced on 2 May 2026. Projects announced under these tenders have committed to add an additional 1.9 GW of generation and 3.7 GWh of storage respectively to Western Australia’s wholesale electricity market. On 23 May 2026, the Australian Government announced the outcome of CIS tender 7, with 19 projects representing 7.8 GW of generation capacity being selected across the NEM. This outcome materially expands the pipeline of government-supported renewable generation and discharge projects and reinforces the role of the CIS in supporting investment. The selected projects include 3 with more than 1 GW of generation capacity:
- Yanco Delta Wind Farm (1,498 MW, NSW)
- Bungaban Wind Energy Project (1,150 MW, QLD)
- Theodore Wind Farm (1,022 MW, QLD)
The CIS targets delivery of projects by 2030, supporting the acceleration of large-scale renewable generation and storage capacity.
As discussed in previous QCMRs, market intelligence has indicated that the fall in LGC prices observed over the last several quarters is unlikely to have a significant influence on investor behaviour in the utility-scale sector, as the signing of power purchase agreements (PPA) prior to projects reaching a final investment decision hedges projects from LGC price risk. Further, more recent projects have planned their finances under assumptions of low LGC prices, and other government programs such as the CIS and state-based schemes like New South Wales’s Long-term Energy Service Agreements are providing support for utility-scale renewable energy projects.
Expectations of ongoing low LGC prices could negatively affect investment in commercial and industrial facilities. These are facilities below 5 MW but above the 100kW threshold for the Small-scale Renewable Energy Scheme. Projects of this size have fewer alternative supports available to them compared to utility-scale projects and are more likely to be built for self-consumption rather than export to the grid, meaning they do not typically sign PPAs. These factors make commercial and industrial renewable energy projects more sensitive to the expected income stream from LGCs.
While FID for these approvals is not always readily publicly available, approvals offer some insight. To date, we have not observed any discernible impact of the reduction in LGC prices since Q4 2024 on commercial and industrial approvals. The average and median quarterly approvals of projects in this category from Q4 2024 to Q1 2026 (46.0 MW and 49.4 MW respectively) are both higher than the corresponding quarterly approvals since Q1 2018 (38.8 MW and 38.0 MW respectively). However, the lead time from design to installation and approval for these systems appears to be at least 8 months. This means that financial commitment to projects being approved in Q1 2026 would likely have occurred around Q2 2025 or earlier, when the LGC price was at or above $20.00.
We will continue to monitor commercial and industrial approvals and provide analysis on any emerging trends in future QCMRs.
Description
This figure shows the capacity of large-scale renewable power stations by fuel source to reach a final investment decision over time.
Small print
The Clean Energy Regulator tracks public announcements. Data may be incomplete and may change retrospectively. Totals may not sum due to rounding.
Strongest Q1 on record for non-RET surrenders
The highest level of voluntary cancellations for a first quarter on record occurred in 2026, coinciding with the sharp decline in LGC spot prices. The 4.1 million non-RET LGC surrenders in Q1 represents a 51% increase on the previous Q1 high of 2.7 million in 2025. Voluntary cancellations from non-government sources accounted for over 83% of quarterly non-RET surrenders and were around 78% higher than the same period last year, indicating significantly stronger participation from corporate and other non-government entities. Government voluntary cancellations accounted for over 15%, while compliance related voluntary cancellations contributed just over 1% of the total non-RET surrenders for the quarter.
Government voluntary cancellations are expected to increase in Q2 2026, primarily driven by the annual surrender by the ACT Government, which is expected to support a strong overall outcome for the non-RET surrenders next quarter.
An oversupplied LGC market and declining LGC prices continued to shape non-RET demand dynamics. Market intelligence indicates increased interest in LGCs by electricity retailers on behalf of their customers, as lower prices improve the affordability of voluntary renewable electricity offerings. This may incentivise further growth in non-RET demand. Further, the ongoing development of market-based scope 2 emissions accounting for NGER reporters may incentivise large Australian corporations to increase participation in the voluntary LGC market (see Market-based emissions accounting and renewable energy certificates (RECs)).
Description
This figure shows non-RET LGC cancellations by demand source over time.
Small print
This classification system is uniform across Australian carbon credit unit (ACCU) and LGC cancellations.
Covered activities for each classification
Voluntary demand
Cancellations made against voluntary certification programs such as Climate Active and any sort of organisational emissions or energy targets.
Government demand
Cancellations by or on behalf of government entities. For example to offset emissions from vehicle fleets or meet voluntary emissions reduction targets.
Compliance demand
Cancellations made by private organisations and corporations for compliance or obligations against local or state and territory government laws, approvals, or contracts. For example to meet Environmental Protection Authority requirements.
CER analysis of Q1 2026 non-RET surrenders shows increased participation by first‑time voluntary surrenderers during a period of lower LGC prices. Of the 4.1 million LGCs surrendered, around 540,000 were surrendered by first-time participants, a substantial increase on the 149,000 first-time surrenders in Q1 2025. The remaining 3.5 million surrenders in Q1 2026 were attributed to repeat surrenderers. This demonstrates that while established surrenderers continue to drive most of the voluntary demand, there is also evidence of new entrants responding to more affordable LGC prices. Notable among the new surrenderers, 2 utility-scale battery storage entities surrendered for the first time in Q1 2026. Battery storage entities have not historically participated in voluntary LGC surrender and their entry may signal emerging market dynamics or new business models in the clean energy sector.
Market-based emissions accounting and renewable energy certificates (RECs)
Voluntary surrender of RECs, such as LGCs and REGO certificates, are key to underpinning an entity’s claim of renewable energy use under market-based emissions accounting frameworks.
Emissions accounting is the process of measuring and reporting an entity’s greenhouse gas (GHG) emissions. Accurate, transparent, and consistent emissions accounting is necessary to report on current emissions, set and track emissions targets, and compare emissions between different entities. A range of robust emissions accounting frameworks exist. There are 2 major frameworks used in Australia:
- The National Greenhouse and Energy Reporting (NGER) scheme, administered by the CER, is the national reporting scheme under which Australia’s largest corporations must report on their annual emissions, energy production, and energy consumption.
- The GHG Protocol Corporate Accounting and Reporting Standard (GHG Protocol) and addendum on Scope 2 Guidance is another common framework for corporate emissions accounting. The mandatory climate-related disclosure component of the Australian Sustainability Reporting Standard (AASB S2) uses the GHG Protocol as its primary measurement framework. Climate-related disclosure requirements apply to a wider range of companies than NGER reporters, so some companies are required to report under both frameworks. NGER reporters can use NGER reporting methods, where applicable, for climate-related disclosure purposes under AASB S2.
Under the various accounting frameworks, there are 2 accounting methods that can be used to estimate emissions:
The location-based method. Under this method, emissions associated with the operations that occur at a physical location are estimated, and the use of offsets or other types of market-based certificates is not recognised.
Emissions associated with the generation of electricity that was not produced on-site are known as scope 2 emissions. When estimating scope 2 emissions using the location-based method, a grid-average emission factor is applied. This emissions factor includes both fossil fuel generation and renewable generation. The same average factor is applied to every unit of grid electricity consumed by an entity, and the emissions ‘benefit’ of renewable generation is evenly spread across the grid, or state on the grid – no single user can lay claim to the emissions decrease from a megawatt hour of renewable energy.
The market-based method. Under this method, organisations report emissions based on the electricity they choose to buy, recognising renewable energy purchases and contracts rather than just the average grid mix. To ensure that the use of renewable electricity can only be used once, the person or entity claiming the use of a unit of renewable electricity verifies that claim by cancelling a market instrument such as a REC created by the generator. The ability to claim the use of renewable energy, and thereby reduce an entity’s scope 2 electricity emissions, is given to the entity that cancels the associated RECs. Emissions from all other grid electricity are worked out using a ‘residual mix factor’ (RMF) – this is like the location-based grid-average emissions factor but deducts the contribution of all renewable electricity that has been issued a REC to ensure those emissions benefits are not double-counted.
Both methods are accurate and internally consistent, though they should not be mixed or directly compared to avoid double-counting energy and emissions. Together, they tell 2 complementary but different policy stories. Market-based accounting shows how an entity is responding to market signals and the emissions effect of changing its energy purchasing behaviour, while location-based accounting illustrates a facility’s overall exposure to the emissions of the grid or system to which it is connected.
NGER and the GHG Protocol both include mandatory location-based and voluntary market-based reporting. The table below sets out key emissions accounting frameworks and the application of scope 2 location- and market-based emissions accounting rules.
| Emissions accounting framework | Use of location-based scope 2 method | Use of market-based scope 2 method |
|---|---|---|
| NGER Mandatory Australian government scheme | Mandatory | Optional |
| Product Guarantee of Origin Voluntary Australian government scheme | Not used | Mandatory |
| Climate Related Disclosures (AASB S2) Mandatory Australian government scheme | Mandatory | Optional |
| ClimateActive Voluntary Australian government scheme | Mandatory | Optional |
| GHG Protocol Non-government scheme | Mandatory | Optional |
At an entity level, the advantage of the market-based method is that it allows for purchases of REC-backed renewable energy to be recognised in organisational emissions accounting. Surrendering RECs allows an entity to prove their use of the equivalent quantity of renewable electricity, providing integrity, credibility and transparency when reporting on emissions and tracking progress towards climate targets using the market-based method. Certificates can also support more granular claims about renewable time-of-use – for example, REGO certificates may be ‘time-stamped’ for generation at hourly, daily, monthly, or yearly intervals to allow users to time-match their renewable energy generation and consumption.
Mandatory use of market-based accounting in the Product Guarantee of Origin (PGO) scheme provides a level of transparency not possible under the location-based method. GO certifies the emissions intensity of products like hydrogen, low carbon fuels, and metals, using the market-based method to provide detailed traceability about the inputs into a product batch. Being able to trace the amount, type and origin of renewable electricity used to create a batch of GO-certified product based on the RECs surrendered provides confidence to the product seller and buyer about its emissions attributes.
Use of voluntary market-based scope 2 NGER reporting
Voluntary market-based scope 2 reporting was first introduced to the NGER scheme for the 2023-2024 reporting year. For the 2024-2025 reporting year, 61 entities reported voluntarily against the market-based scope 2 method, up from 36 in 2023-2024. Of these 61 entities, 34 were above the publication threshold. In 2024-2025, 28 published entities cancelled a combined 0.9 million LGCs to demonstrate a reduction in their scope 2 emissions, up from 0.5 million cancellations by 16 published entities in the previous year. Sectors using the method included retail, education, finance, utilities, real estate, heavy industry, food production, and transport.
It is expected that more entities will report using NGER market methods over time. In addition to supporting corporate emissions reporting and providing transparency towards climate targets, NGER legislation was also amended in mid-2025 to improve usability of the market method and reduce barriers to its use. The amended National Greenhouse and Energy Reporting (Measurement) Amendment (2025 Update) Determination 2025 allows voluntary LGC surrenders made at any time before an entity submits its NGER report to be used to offset scope 2 emissions, provided the LGC has a generation date within 36 months of the end of the reporting period. This replaces the previous requirement that surrender occur within the reporting year. NGER reporting is due on 31 October of each year. The amendment considered public consultation which took place from 28 February 2025 to 11 April 2025. A summary of consultation outcomes is available on DCCEEW’s website, together with non-confidential submissions.
The extended surrender period gives NGER entities greater flexibility in managing their scope 2 emissions and may encourage greater voluntary surrender of LGCs. More information on the amendment can be found on NGER legislation amendments for the 2025–26 reporting year.
Market-based scope 1 accounting and outlook
Scope 1 emissions are ‘direct’ emissions resulting from on-site activities at a facility. Market-based emissions accounting is also beginning to emerge for scope 1 emissions accounting. It is especially useful when accounting for renewable fuels that are transported through shared or co-mingled infrastructure with their conventional fossil fuel equivalents.
- The NGER scheme permits entities that combust liquid and gaseous fuels sourced from a network to use market instruments to prove the use of low-emissions equivalents, such as renewable diesel, biomethane or hydrogen, and correspondingly report lower emissions. The 2026 NGER scheme updates propose expanding this framework by adding market-based accounting methods for use of co-processed liquid fuels.
- The Clean Energy Regulator administered Product Guarantee of Origin (GO) certificate, which currently certifies hydrogen from electrolysis and is slated to expand to other energy products, will be one of the accepted certificate types to prove use of low-emissions fuels under the market-based scope 1 emissions accounting methods.
Market-based emissions accounting is critical to developing markets and economic signals for low-emissions energy products. Use of market-based approaches are expected to grow as more entities seek to report on emissions reductions through renewable energy procurements, underpinned by credible and transparent certificates and units.
LGC holdings totalled 35.9 million certificates at the end of Q1 2026, representing an increase of 36% compared with Q1 2025, when holdings stood at 26.5 million LGCs. Growth in holdings was driven by power stations, which accounted for around 15 percentage points of the net increase, followed by liable entities (11 percentage points) and non-RET voluntary (10 percentage points).
Description
This figure shows LGC holdings in Renewable Energy Certificate (REC) Registry accounts by market participation category over time.
Small print
Holdings are for registered LGCs as at the end of the quarter and exclude any pending transactions. Accounts are categorised according to their primary role or function based on transaction patterns and the name of the account. An account's category is subject to change. Totals may not sum due to rounding.
Category definitions
Liable entity
Account holder is a liable entity.
Power station
The account holder has created more LGCs than it has surrendered.
Non-RET (voluntary)
The majority of LGCs surrendered by the account holder have been surrendered voluntarily, or the account is labelled as 'GreenPower' in the REC registry.
Non-RET (compliance)
The majority of LGCs surrendered by the account holder have been surrendered voluntarily for non-RET compliance reasons (for example, desalination plants).
Non-RET (government)
The majority of LGCs surrendered by the account holder have been surrendered voluntarily for a government entity.
Intermediary
Account holder has transacted/received over 100,000 LGCs and does not fit into any of the other categories.
Other
Account holder does not fit into any of the other categories.
First REGO certificates created
In Q1 2026, the first REGO certificates were created, marking the commencement of a new certification framework that will operate alongside the LRET.
The REGO scheme commenced on 3 November 2025 and will provide an ongoing renewable electricity certification mechanism after the end of the RET in 2030, with expanded fuel source eligibility and greater depth of information for each certificate.
REGO certificates are digital documents that are issued for each MWh of renewable electricity generated or dispatched. They are a market-based instrument that are designed to demonstrate the use of renewable electricity in market-based accounting frameworks. This empowers Australian businesses to make confident, objective, and credible claims about the renewable electricity they generate or use.
REGO certificates are tradeable instruments like LGCs, but unlike the LRET, the REGO scheme does not include annual targets or compliance obligations. Only LGCs can be surrendered for compliance under the LRET. During the period to the end of 2030, eligible facilities may choose to create either LGCs or REGOs for each unit of renewable electricity generated.
REGOs show key details for generated renewable electricity, including when renewable electricity was made, with support for hourly timestamping of generation. Other key information includes details of the generating facility including its location, fuel source, and any attributes relating to First Nations or other characteristics of the facility, as well as whether the certificate has been retired or transferred.
Learn more about the REGO scheme.