
The QCMR report consolidates information across the national carbon markets that the CER administers for the March quarter (January to March) 2026. It provides information on supply and demand trends and opportunities that may inform market decisions.
On this page
Highlights
- Distributed energy is reshaping grid dynamics, with the latest real-world data showing solar‑battery households importing less from the grid and exporting more during evening peak periods. If strong installs for small-scale solar and batteries are sustained, we could see a step change in the contribution of distributed energy resources to the grid. Consideration of the implications of additional storage will be increasingly important for understanding grid dynamics and the contribution of renewables to reaching emissions reduction targets.
- For example, additional distribution system storage is likely to reduce instances where large-scale renewable generators lower their output due to low or negative prices.
- Battery uptake surged during the quarter and beyond. Across Australia, there are now more than 400,000 batteries installed – including validated and pending systems as at mid-May – representing over 11.4 GWh of usable capacity.
- Industry analysis puts the total global battery installations for 2025 at 257 GWh, with around 80% in utility-scale systems. Within the remaining small-scale segment, Australia’s installations are substantial by international standards.
- Some demand reflects consumers installing systems ahead of the May program reforms, designed to maintain a similar level of support across battery sizes. That said, reductions in battery prices as the technology matures could increase battery sizes over time.
- We expect demand for batteries to remain high post-reform, but with smaller average sizes.
- Small‑scale solar hit record levels, with 791 MW installed in Q1 2026. Over the past year, additional generation from small-scale solar installations have offset underlying electricity demand growth in the NEM. The outlook for small-scale solar installations is strong for 2026.
- Renewables reached a new Q1 high, accounting for 47% of NEM generation, driven by strong wind and solar output and a decline in thermal generation.
- Growing battery capacity is also enabling higher renewable penetration, shifting energy across time and reducing reliance on coal- and gas-fired generation for evening peaks.
- Large-scale renewables investment remains healthy: 1.1 GW was approved and 946 MW reached final investment decision (FID) in Q1 2026. Post-quarter decisions see FID of 2.4 GW so far this year.
- Record renewable generation increased LGC oversupply despite growing voluntary demand.
- Non-RET surrenders reached a record Q1 level of 4.1 million LGCs, driven by non-government demand and lower prices attracting new entrants. First‑time participation increased significantly, with around 540,000 LGCs surrendered by new entrants, up from 149,000 in Q1 2025.
- The Renewable Electricity Guarantee of Origin scheme saw its first certificates issued in the quarter.
- Data from the 2024-25 compliance year for the Safeguard Mechanism indicate the scheme continues to progress well in line with expectations and policy settings.
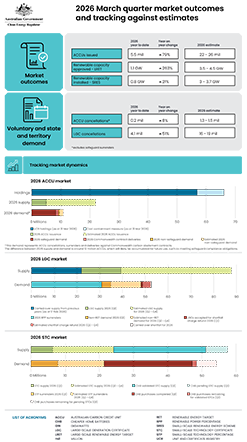
- Of the 208 facilities covered for the 2024-25 reporting period, 141 facilities’ net emissions exceeded their baselines with a total excess of 13.7 Mt CO2-e. To manage excess emissions, entities surrendered 10.8 million ACCUs and 2.6 million SMCs. ACCU issuance remains strong with a record Q1 of 5.5 million ACCUs. Issuances in 2026 are on track for 22 to 26 million ACCUs.
- ACCU holdings, excluding the cost containment measure, decreased by 4.2 million to 56.5 million at the end of Q1 2026 as Safeguard Mechanism entities surrendered for compliance purposes.
- With declining baselines under the Safeguard Mechanism, we expect a drawdown of accumulated holdings later this decade.
Click on the image below to download a full-sized version.
Ways to read the report
Data workbook
The QCMR data workbook – March quarter 2026 contains the data underlying the figures in the report and additional data, including longer time series data.
Updated: 3 June 2026
Changes
- Figure 1.6 - Generic Australian carbon credit unit (ACCU) and Safeguard Mechanism credit unit (SMC) volume weighted average spot price (updated with post quarter data)
- Figure 2.3 - Large-scale generation certificate (LGC) reported spot and forward prices (updated data)
- Figure 3.4 - Distribution of validated battery installations by installation type by month (updated data)
- Figure 3.6 - Small-scale technology certificate (STC) reported spot and clearing house prices (updated data)
- Figure 3.7 - Small-scale technology certificate (STC) market transactions (updated to include STC transactions where STCs were from the CHBP)
New:
- Figure 1.1 - Progress towards net emissions target of ≤ 100 Mt CO2-e in 2029-30
- Figure 1.5 - Volume of Australian carbon credit unit (ACCU) holdings (in millions) by location of account
- Figure 1.9 - Estimated Australian carbon credit unit (ACCU) issuances (in millions) in 2026
- Figure 1.10 - Changes in the sequestration bank and release for a hypothetical savanna fire management project
- Figure 2.1 - Change in NEM supply mix by fuel type - Q1 2026 vs Q1 2025
- Figure 3.1 - Percentage of small-scale solar systems installed with a battery by month
Media release
Read the media release: Record battery and solar growth reshaping energy grid