
Small-scale Renewable Energy Scheme
Insights
- Distributed small‑scale solar and battery systems continue to scale rapidly. Real-world grid data already show changes to household energy use, and we expect further changes to market dynamics and grid outcomes as our substantial distributed energy system continues to evolve.
- The Cheaper Home Batteries Program continues to drive a surge of installations, with more than 82,000 validated batteries, or over 2.5 GWh of storage capacity, installed in Q1 2026.
- Total storage capacity installed under the program reached 11.4 GWh across more than 400,000 installations (both validated and pending) by mid-May. This represents less than a year’s worth of installations, placing Australia at the global forefront of small-scale storage. Industry analysis puts total global installations for 2025 at 257 GWh, around 80% of which is utility scale.
- Growth in battery sizes may be driven by consumers taking advantage of the higher effective rebate available for them before the 1 May 2026 batteries program reforms. We expect demand for batteries to remain high post-reform, but with smaller average sizes.
- The positive impacts of solar batteries are visible in emerging patterns in household solar and battery behaviour visible in intraday demand profiles. Residential demand data from the Australian Energy Market Operator (AEMO) shows that households with solar and batteries are shifting grid interactions by importing less electricity and exporting more energy during evening peaks.
- With the rapid growth in distributed generation and storage assets, it is particularly important to ensure consumer benefits from the rapid upscaling of household generation and storage are maximised. As announced in the 2026–27 Budget, the Clean Energy Regulator will be the National Technical Regulator for consumer energy resources.
- Small-scale solar set a Q1 record with 791 MW installed capacity across 77,000 installations. AEMO Q1 2026 data show how material small-scale solar capacity growth is for the National Electricity Market (NEM), with growth in small-scale solar output offsetting growth in electricity demand over the year and increasing the share of NEM electricity supplied by renewables.
- Strong Q1 solar outcomes may partly reflect accelerated concurrent installations of small-scale solar and batteries ahead of the 1 May 2026 reforms.
- The average system size for a small-scale solar system in Q1 was 10.3 kW and has now been greater than 10 kW for the past 3 quarters.
- Replacement rates continue to increase, with 27% of systems installed in Q1 2026 being replacement systems, up from 19% in Q1 2025.
- Some of the states with the highest replacement rates are those where legacy feed-in tariffs will expire over coming years, so customers may have brought forward system replacements ahead of the 1 May battery program reforms.
- Small-scale technology certificate (STC) prices fell slightly over Q1 2026, settling to $39.65 as at the end of the quarter, while the Clearing House remained in surplus for the quarter.
Click on the image to download a full-sized version.
On this page
- Battery installations exceed strong in Q1 2026
- Market dynamics
- Q1 sets a record for small-scale solar capacity; outlook strong
- Small-scale solar replacements on the rise
- First quarter shows growth for air source heat pumps (ASHPs)
Battery installations strong in Q1 2026
The batteries program continues to drive exceptionally high levels of battery uptake, as the program reaches 7.4 GWh of validated usable capacity installed as of Q1 2026, with more than 284,000 validated batteries installed. Q1 added at least of 2.5 GWh of battery capacity from 82,000 batteries.
Description
This figure shows the monthly cumulative installed capacity of validated small-scale battery installations per state by installation date following the commencement of the Cheaper Home Batteries Program on 1 July 2025.
Small print
A 12 month creation period for registered persons to create small-scale technology certificates applies under the Renewable Energy (Electricity) Regulations (2001). Data is subject to change due to the 12 month creation rule. Totals may not sum due to rounding.
The average usable capacity installed has increased each quarter since the introduction of the batteries program. Nationally, installations in Q1 2026 averaged 30.6 kWh of useable capacity, up from 27.3 kWh in Q4 2025 and 19.7 kWh in Q3 2025.
The increase in average system size in Q1 2026 reflects both the continuation of the shift toward higher-capacity systems together with behavioural responses ahead of the 1 May program changes (see Changes to the Cheaper Home Batteries Program). Behavioural changes may include both installers prioritising larger systems and consumers who prefer higher‑capacity batteries bringing installations forward. We anticipate average system sizes being installed to decrease after the 1 May 2026 changes, as the progressive tapering of STCs reduces the relative incentive for larger batteries.
While the available data do not yet allow for a definitive assessment of post‑reform consumer behaviour, we expect a moderation in average battery sizes following the introduction of the 1 May 2026 reforms, consistent with their policy intent. Following the initial moderation in battery sizes after the 1 May reforms, average capacities are likely to increase over time as the technology matures and costs decline. Industry feedback indicates installations will remain strong, particularly from residential consumers.
Changes to the Cheaper Home Batteries Program
Changes to how small-scale technology certificates (STCs) are generated under the battery program took effect on battery installations from 1 May 2026. These changes affect how many STCs are created for eligible battery installations and, in turn, the level of financial support available through the scheme.
Under the 1 May 2026 reforms, the STC Factor that determines how many STCs a battery is entitled to create per kilowatt‑hour of usable capacity was adjusted. The STC Factor now declines more frequently, shifting from annual to six‑monthly reductions, and declines at a faster rate over time.
The reforms also introduced a progressive tapering of the STC Factor based on the usable capacity of a battery. As previously, batteries with usable capacities up to 100 kWh are eligible under the scheme, with STCs calculated on the first 50 kWh of usable capacity. Within the first 50 kWh, different portions of capacity now receive a different percentage of the STC Factor. Under the tapering arrangement, the percentage of the STC Factor applied is:
100% for the first 14 kWh of usable capacity
60% for each additional kWh above 14 kWh and up to 28 kWh (inclusive)
15% for each additional kWh above 28 kWh and up to 50 kWh (inclusive).
These thresholds were designed to maintain a broadly similar level of support for a range of battery sizes.
As an example of the calculation under the tapered system, a 40-kWh battery installed between 1 May 2026 and 31 December 2026 generates 164 STCs on validation, calculated as:
14 kWh at 100% of the STC Factor (95 STCs)
14 kWh at 60% of the STC Factor (57 STCs)
12 kWh at 15% of the STC Factor (12 STCs).
Further information on the 1 May 2026 changes, including applicable STC Factor rates, is available on DCCEEW’s Cheaper Home Batteries Program webpage. The Clean Energy Regulator’s solar battery STC calculator can be used to estimate the number of STCs created for individual eligible battery installations.
Description
This figure shows the distribution of validated small-scale battery installations at residential buildings across usable capacity ranges, following the commencement of the Cheaper Home Batteries Program on 1 July 2025.
The battery capacity ranges are aligned with the tapering of STCs for larger batteries under the changes to the Cheaper Home Batteries Program, which will come into effect on 1 May 2026. For more information, please visit Cheaper Home Batteries Program.
Small print
A 12 month creation period for registered persons to create small-scale technology certificates applies under the Renewable Energy (Electricity) Regulations (2001). Data is subject to change due to the 12 month creation rule.
Systems with capacities on the border between ranges are included in the higher range. For example, a 15 kWh system would be included in the 15-20 kWh range.
Description
This figure shows the distribution of validated small-scale battery installations at non-residential buildings across usable capacity ranges, following the commencement of the Cheaper Home Batteries Program on 1 July 2025.
The battery capacity ranges are aligned with the tapering of STCs for larger batteries under the changes to the Cheaper Home Batteries Program, which will come into effect on 1 May 2026. For more information, please visit Cheaper Home Batteries Program.
Small print
A 12 month creation period for registered persons to create small-scale technology certificates applies under the Renewable Energy (Electricity) Regulations (2001). Data is subject to change due to the 12 month creation rule.
Systems with capacities on the border between ranges are included in the higher range. For example, a 15 kWh system would be included in the 15-20 kWh range.
The distribution of installations between retrofits and concurrent installations has remained stable over the 3 quarters of the program so far.
As of Q1 2026, around 52% of all battery installations were retrofits to addresses with existing small-scale solar systems, with no change to the solar installation. The remaining 48% of battery installations were installed concurrently with small-scale solar systems, comprising a mix of new installations and systems that upgraded or replaced existing solar, with a slight preference toward upgrades or replacements.
Description
This figure shows the distribution of validated small-scale battery installations by installation type by month of installation, following the commencement of the Cheaper Home Batteries Program on 1 July 2025.
Small print
A 12 month creation period for registered persons to create small-scale technology certificates applies under the Renewable Energy (Electricity) Regulations (2001). Data is subject to change due to the 12 month creation rule.
Category definitions
Retrofit installation
Battery installations that were installed more than 90 days after the associated solar PV installation.
Concurrent installation with new solar PV
Battery installations that were installed within 90 days of the associated solar PV installation. The solar PV installation was a new installation for the address.
Concurrent installation with upgraded solar PV
Battery installations that were installed within 90 days of the associated solar PV installation. The solar PV installation was a replacement, extension, or addition for an existing solar PV system at the address.
In an analysis of household battery demand profiles, AEMO observed that households with batteries export electricity later into the day and rely less on grid‑supplied electricity during evening peak periods compared with households with rooftop solar only. In aggregate, this behaviour reduces household demand from the grid during peak periods and increases the availability of stored solar generation later in the day, moderating net demand on the grid during the evening peak. While these behaviours reduce grid‑supplied demand during peak periods, over time increased access to low‑cost solar and stored energy may lead to higher overall household electricity consumption; these changes can be considered as the grid evolves.
Wholesale electricity prices in the NEM reflect the price that balances supply and demand at each 5-minute interval. By reducing grid demand during peak periods, increased household battery discharge would generally be expected to place downward pressure on prices, all else being equal. AEMO’s latest report shows NEM wholesale prices are 12% lower than the same quarter last year. As discussed in Chapter 2, the main cited drivers are large-scale, with higher utility-scale batteries influencing prices setting and higher levels of large-scale renewable generation.
In the 2026-27 Budget, the Government announced that the Clean Energy Regulator will fulfil a new role as National Technical Regulator (NTR) to support a national approval and compliance framework for how consumer energy devices work together to maximise benefits (interoperability). This will include ensuring new consumer energy resources meet national standards, are installed by accredited professionals, and are recorded in a centralised national register of installed devices. These functions are designed to enable the secure and efficient integration of small-scale generation and batteries into the national electricity system, which will support a stable, integrated electricity grid and achievement of the 82% renewables by 2030 target.
This framework is a key reform for modernising Australia’s economy by improving productivity and increasing competition across Australia’s energy ecosystem and enabling new energy market services. It will empower Australian households to maximise the benefits of their own energy systems and contribute to Australia’s electricity markets if they choose.
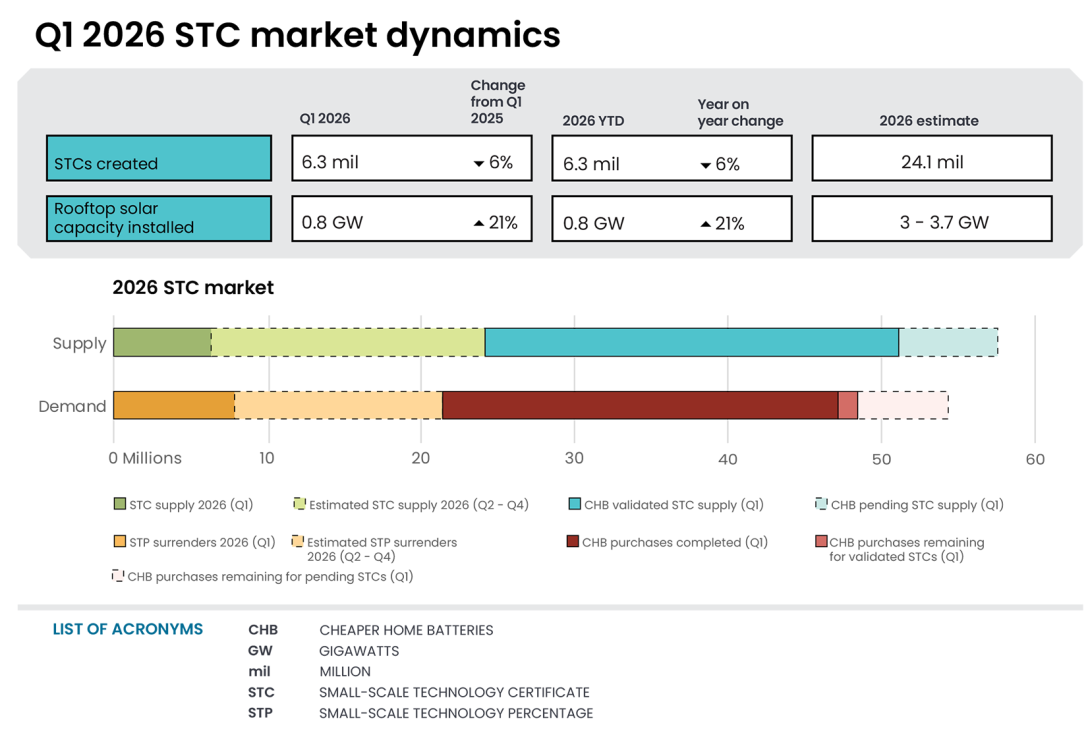
Market dynamics
In Q1 2026, 6.3 million STCs were created, excluding STCs created as part of the batteries program. On average, 489,000 STCs were created per week during Q1 2026, which exceeds the average 462,000 requirement to meet the compliance demand of 21.5 million set for the 2026 STP.
Description
This figure shows the weekly supply of STCs in 2026. It also shows the required weekly supply of STCs (462,192) to meet the 2026 STP.
Small print
Required STC supply refers to the estimated number of STCs to be created (24.1 million) to meet the annual STP liability in 2026. Some weeks are spread across multiple months; the month label refers to the month as of the end of the week. STC creations in weeks at the start and end of the shown period may be significantly lower than in other weeks in the year due to them being shorter as a result of the start and end of the quarter.
Figure only includes STCs from the installation of small-scale solar, solar water heater, and air source heat pump systems. STCs from batteries are not included as they are being purchased by the Government and are not available to liable entities to meet their liabilities under the SRES.
By the 28 April Q1 deadline, 7.5 million STCs were surrendered. Between 15 February and the 28 April deadline, around 426,000 STCs were purchased from the clearing house (excluding STCs purchased by the government under the batteries program), with most surrenders met through certificates sourced outside the clearing house.
Small‑scale technology certificates can be sold either through the STC clearing house at the fixed clearing house price of $40 or through the open market. STC prices remained below $40 through Q1 2026, reflecting ongoing surplus conditions in the clearing house. The STC spot price opened the year at $39.65, briefly increased to $39.90 in early February, and then settled back to $39.65 by the end of the quarter. The spot price has remained steady in the period after the end of Q1, sitting at $39.62 on 15 May 2026.
Small-scale technology certificate (STC) reported spot and clearing house prices
Note: This figure is not interactive.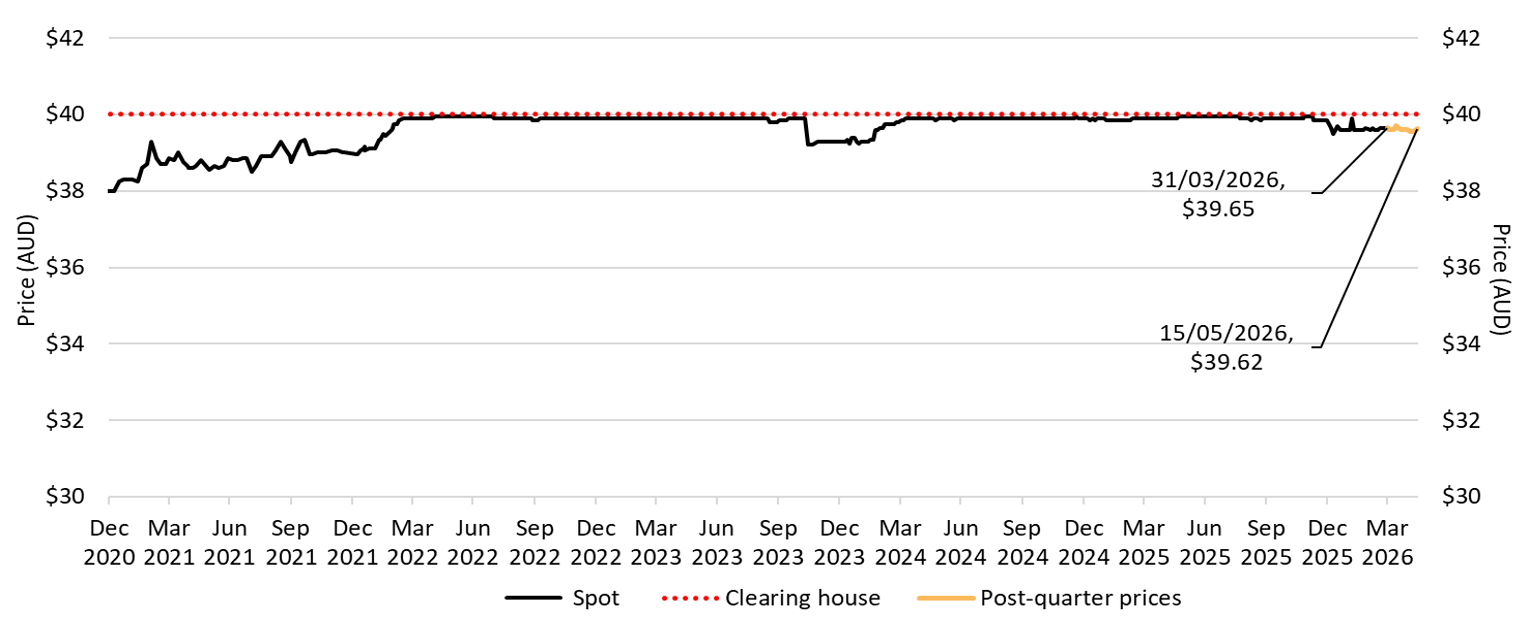
Description
This figure shows the daily closing STC spot price over time. It also shows the STC clearing house price.
Small print
Pricing data is complied from trades reported by CORE markets and may not be comprehensive. Prices are shown from 31 December 2020 to 15 May 2026. The last spot price recorded for the quarter is labelled.
Read more about buying and selling STCs, including through the clearing house.
STC market activity increased markedly through the second half of 2025 and into Q1 2026, reflecting substantially higher volumes of certificates being transacted in the open market. A total of 38.7 million STCs were transferred in Q1 2026, the highest quarterly volume on record. This increase reflects a higher availability of STCs in the market, largely associated with the rapid scaling of battery installations, which has resulted in a greater volume of battery‑related STCs being transacted alongside certificates from other sources.
In contrast, activity through the STC clearing house declined. STC purchases from the clearing house (excluding purchases by DCCEEW) totalled 1.2 million STCs in Q1 2026, down 73% from 4.5 million STCs in Q1 2025. This decline coincided with increased clearing house queue wait times and 4.5 million STCs being withdrawn from the queue during the quarter.
Despite these changes in trading behaviour, STC prices remained close to the clearing house price of $40 throughout the quarter, indicating that demand at the clearing house price remains resilient even as participants adjust between sales channels.
Description
This figure shows the volume of STCs transacted and the number of transactions, excluding STC clearing house transactions, over time.
Q1 2026 sets a record for small-scale solar capacity; outlook strong
Installed small-scale solar capacity reached a new Q1 record in 2026. Over the quarter, 791 MW of small-scale solar capacity was installed, a 21% increase from 655 MW in Q1 2025 and a new Q1 record for capacity installed. The number of installations was also strong with 77,000 systems, 15% more than the 67,000 installations in Q1 2025. Installation numbers have kept their pace in the start of Q2, with April 2026 capacity at 467 MW as of 15 May, more than double the 207 MW capacity installed in April 2025. Some of this strength may reflect increased interest in higher‑capacity solar systems among households installing batteries, where larger or upgraded solar systems can better support battery charging and use.
Part of the strong Q1 outcome may have been the result of short‑term timing effects ahead of the changes to the batteries program that commenced on 1 May 2026, affecting installer scheduling and consumer decisions. As such, some component of the Q1 strength may be transitory. That said, industry feedback suggests there may be significant ongoing demand for solar installations, including upgrades of older systems.
If strong installs for small-scale solar and batteries are sustained, we could see a step change in the contribution of distributed energy resources to the grid, and consideration of the implications will be increasingly important. The impact and importance of distributed energy resources for our electricity grid and in progressing towards the government’s 82% renewables target are already visible in the latest AEMO figures for the NEM.
- AEMO showed a record Q1 total demand for electricity, while grid-supplied (‘operational’) demand remained roughly the same as Q1 the previous year. That is, household solar output offset growth in underlying demand.
- The use of electricity stored by household batteries also contributes to a higher renewable energy penetration in the grid through downward pressure on grid demand, lowering the need for grid electricity from gas power stations during peak demand periods.
- Reduced grid demand from households and taking advantage of the ability to coordinate distributed energy resources, means less new large scale renewable generation and storage are needed over the same timeframes to meet our overall energy needs.
We will continue to monitor small-scale solar installations and report on any trends observed in future QCMRs.
Description
This figure shows the installed capacity in megawatts (MW) and the number of small-scale rooftop solar installations over time.
Small print
Small-scale rooftop solar systems must have a capacity of less than 100 kilowatts (kW). A 12 month creation period for registered persons to create small-scale technology certificates applies under the Renewable Energy (Electricity) Regulations (2001). Data for installations and installed capacity in the past 12 months have been lag-adjusted to account for the 12 month creation rule and are estimates only. Data is subject to change and totals may not sum due to rounding. Non-lag adjusted figures are available on Small-scale installation postcode data.
The average small-scale solar system size in Q1 2026 was 10.3 kW, marking the third quarter in a row where the average system size has been greater than 10 kW. This trend has been driven by the growth in the popularity of installations sized between 15-40 kW which represented 22% of total installs in Q1 2026, compared to 14% in Q1 2025. There has also been a decrease in the popularity of systems sized between 5-10 kW, which fell from 37% of all installations in Q1 2025 to 32% in Q1 2026. While this upward trend in system size predates the Cheaper Home Batteries Program, installations that include a battery tend to be larger, with the average capacity of a small-scale solar system installed with a battery at 11.1 kW since the start of the scheme, compared to 9.1 kW for systems not installed with a battery.
Description
This figure shows the proportion of rooftop solar systems installed under the Small-scale Renewable Energy Scheme (SRES) by capacity band and the average size of rooftop solar systems installed under the SRES over time.
Small print
A 12 month creation period for registered persons to create small-scale technology certificates applies under the Renewable Energy (Electricity) Regulations (2001). Capacity band data has not been lag-adjusted. Average system size data has been lag-adjusted. Data is subject to change. Totals may not sum to 100% due to rounding.
Another feature of recent installation patterns is the increasing share of small‑scale solar systems being installed alongside batteries. Since the introduction of the batteries program, the proportion of solar systems installed with a battery has risen from 53% in the first quarter of the program to 71% in Q1 2026. This trend suggests that batteries are increasingly being incorporated as a standard installation alongside household solar systems. Solar and battery installations appear to be becoming more closely integrated, reflecting a shift toward combined system configurations rather than independent deployment of generation and storage.
Description
This figure shows the proportion of rooftop solar systems installed under the Small-scale Renewable Energy Scheme (SRES) that were also installed with a battery under the Cheaper Home Batteries Program by month.
Small print
A 12 month creation period for registered persons to create small-scale technology certificates applies under the Renewable Energy (Electricity) Regulations (2001). Data has not been lag-adjusted. Data is subject to change.
Small-scale solar replacements on the rise
Replacements accounted for 27% of all small-scale solar installations across the country in Q1 2026, up 8 percentage points compared to the same quarter in 2025. The replacement rate has been steadily growing across all states and territories since the installation type data was first recorded in 2021. Part of the increase in replacement and upgrade activity may reflect households reassessing older solar systems when installing batteries, where larger or upgraded solar systems can better align with battery charging and use. Replacement trends may also be influenced by other factors, including the approaching expiry of legacy feed-in tariffs in some states.
The biggest increase in replacement rate was in Queensland, which saw an increase from 33% in Q4 2025 to 40% of all installations in the current quarter. The surge of replacements may have been caused by the approaching end to the Solar Bonus Scheme 44 cent feed-in tariff (FiT) in 2028, which previously constrained system changes for households in Queensland to remain eligible for the FiT.
South Australia similarly has a 44-cent legacy FiT expiring in 2028 for systems installed prior to 30 September 2011. As the end of the FiT approaches, the replacement rate in South Australia has steadily increased, reaching 31% of installations in the state in Q1 2026.
A spike in small-scale solar replacements can also be seen in Q4 2024 in Victoria, when the state’s 60 cent FiT ended in November 2024. In Q4 2024, the state’s replacement rate reached a record high for the state of 16%.
Description
This figure shows small-scale rooftop solar replacements as a proportion of total installations by state and territory over time.
Small print
Replacements represent small-scale rooftop solar systems categorised in the Renewable Energy Certificate (REC) Registry as replacements. The installation type data field was added to the REC Registry in late 2020, and was made mandatory from 28 January 2021. Data has not been lag-adjusted. Data is subject to change due to the 12 month creation rule.
First quarter shows growth for air source heat pumps (ASHPs)
In Q1 2026, around 21,000 ASHPs were installed, a 9% increase compared to Q1 2025, when around 19,000 systems were installed. The increase was driven primarily by installations in Queensland and Western Australia, which saw the strongest year-on-year growth. Queensland had 3,100 installations in the quarter, an increase of 57% compared to the 2,000 installed in Q1 2025. Western Australia had 2,300 ASHPs installed in Q1 2026, an increase of 55% compared to the 1,500 installed in Q1 2025.
In contrast, Victoria saw a modest 5% year-on-year decline in installations in Q1 2026 with 11,000 installations compared to 11,600 in Q1 2025. Despite this, Victoria remained the largest ASHP market nationally, with Queensland having the second-highest number of installations in Q1 2026.
Description
This figure shows the number of air source heat pump (ASHP) installations under the Small-scale Renewable Energy Scheme (SRES) by state and territory over time. It also shows the number of STCs validated from these installations over time. Totals may not sum due to rounding applied to NT.
Small print
Where cell values are less than 10, data have been modified due to privacy considerations. In the figure these values appear as 10.
There are no STC validations in 2010 as this was before the start of the Small-scale Renewable Energy Scheme.
A 12 month creation period for registered persons to create small-scale technology certificates (STCs) applies under the Renewable Energy (Electricity) Regulations (2001). Data for installations for the past 12 months have been lag-adjusted to account for the 12 month creation rule and are estimates only. STC validation data has been rounded to the nearest thousand. Data is subject to change. Non-lag adjusted figures are available on Small-scale installation postcode data.