
Large-scale generation certificates (LGCs)
On this page
- Market dynamics
- LGCs available for shortfall refund evenly spread across vintages
- Approvals lower in Q1 but pipeline healthy
- Supply and demand for LGCs, and implications for price and investment
- 2025 may be a record for capacity reaching FID despite a modest Q1
- Strong start to non-RET demand in Q1
- Renewable Electricity Guarantee of Origin Scheme to start this year
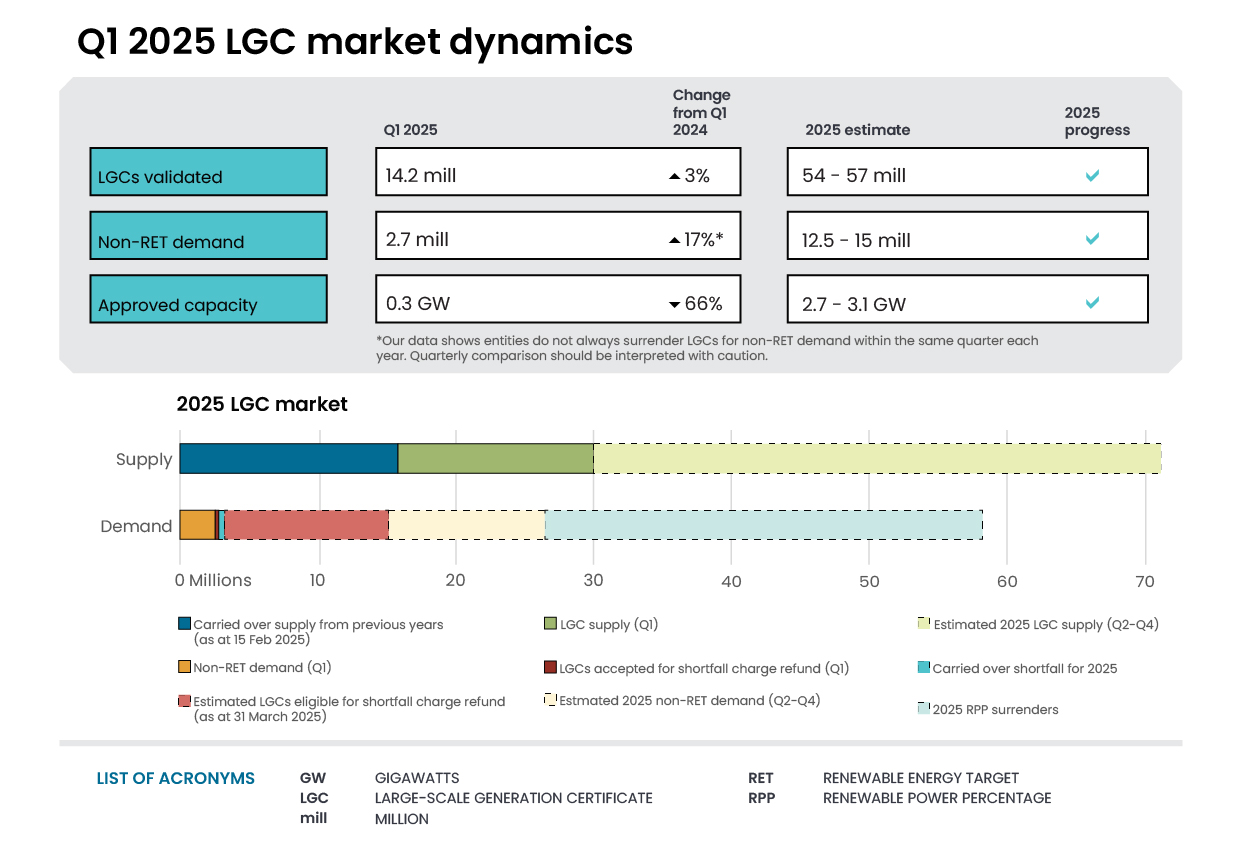
Market dynamics
| LGCs (millions) | ||
|---|---|---|
| Supply | Demand | |
| Supply carried over from previous years (as of 15 Feb 2025) | 15.9 | |
| LGC supply (Q1 2025) | +14.2 | |
| Estimated 2025 LGC supply (Q2-Q4 2025) | +39.8 to +42.8 | |
| Non-RET demand (Q1 2025) | -2.7 | |
| Estimated 2025 non-RET demand (Q2-Q4 2025) | -9.8 to -12.3 | |
| 2025 RPP surrenders (before any shortfall) | -32.0 | |
| LGCs accepted for shortfall charge refund (Q1 2025) | -0.3 | |
| Estimated shortfall charge refund (Q2-Q4 2025) | -4.1 | |
| Carried over shortfall for 2025 (less than 10% of liability) | -0.4 | |
| Estimated balance as of 15 Feb 2026^ | 20.6 to 21.1 | |
Notes: There is a total of 12.0 million LGCs in shortfall that are eligible for shortfall refunds to be claimed, representing $780.2 million in consolidated revenue.
Estimated 2025 LGC supply, and non-RET demand (Q2-Q4) based on the range of CER estimates for 2025 LGC creations (54 to 57 million) and non-RET surrenders (12.5 million to 15 million) after subtracting Q1 2025 figures.
^Sum of all supply items, less the sum of all demand items. This assumes no further shortfall is taken for the 2025 compliance year.
LGC creations are a function of eligible installed generation capacity and how much of that capacity is used to produce electricity, which in turn is affected by weather conditions and economics.
In Q1 2025, large scale solar and wind generation contributed about 14 TWh to the National Electricity Market (NEM) and the South-West Interconnected System (SWIS) in Western Australia. 14.2 million LGCs were created, a small increase compared to the 13.8 million created in Q1 2024 and a new overall record. With average weather over the remainder of 2025, annual LGC creations are currently tracking towards the higher end of our projection of 54 million to 57 million certificates compared to 51.5 million in 2024.
Wind, solar and biomass technologies saw growth in LGC creations compared to Q1 2024, while hydro saw a decrease of 78%. The decline in hydro generation was driven by reduced generation in NSW and Tasmania. This reflects below-average rainfall in NSW and parts of Tasmania throughout the summer months.
Overall shares of renewable generation depend on total renewable generation and electricity demand. (Total renewable generation includes some capacity pre-dating the Renewable Energy Target and therefore ineligible to create LGCs.) In Q1 2025 in the NEM, data from the Australian Energy Market Operator shows that renewables provided a record Q1 average of 43% of the generation mix, exceeding the previous Q1 record of 39% in Q1 2024. Grid-scale solar generation reached an all-time high of 9.3% and wind generation a new Q1 high of 13.7%, both driven by new and commissioning facilities. Western Australia's SWIS also set a record for average Q1 renewable generation, at 41.7%.
Large-scale generation certificates (LGCs) validated by technology type
Note: This figure is not interactive.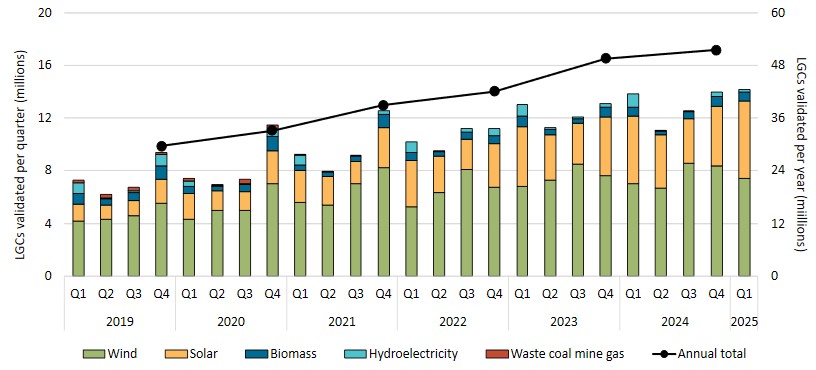
Description
This figure shows the number of LGCs validated by technology type per quarter from 1 January 2019 to 31 March 2025 in stacked columns. The technology types are as follows: wind, solar, biomass, hydroelectricity, and waste coal mine gas. This figure also shows the annual total of LGCs validated per year as line.
This figure is interactive. Hover over/tap each segment to see the number of LGCs. Hover over/tap along the line to see the annual total. Click/tap on the items in the legend to hide/show data in the figure.
Small print
Waste coal mine gas is no longer eligible to create LGCs as of 2021. Validations in 2021 reflect LGCs that were created prior to 2021.
The LGC spot price peaked at $33.00 early in the quarter before dropping 32% to end Q1 2025 at $22.50. The decline in the spot price has continued into Q2, sitting at $21.25 on 23 May 2025.
LGC futures prices have followed a similar trend over the quarter and afterwards. Cal26, 27 and 28 vintages finished the quarter at $21.75, $15.00, and $15.50 respectively, while the Cal25 ended higher than spot ('in contango') at $23.75.
Overall, LGC supply exceeds expected compliance and non-RET demand, even with robust growth in voluntary demand. The RET and other policies have incentivised large-scale renewables investment with around 55,500 GWh of renewable generation expected this year, well above the RET's 33,000 GWh target. The RET will cease in 2030, and other policy settings are in place or are being considered to drive investment decisions and certify renewable generation. LGC supply and demand are discussed further in Box 1 and certification under the Renewable Electricity Guarantee of Origin scheme is discussed further below.
LGCs available for shortfall refund evenly spread across vintages
Liable entities have the option of paying a shortfall charge of $65 per LGC rather than surrendering certificates. This shortfall charge is refunded if the outstanding LGCs are surrendered within 3 years of paying the shortfall charge.
Taking shortfall is attractive if the difference between the LGC spot price and expected future LGC prices is wide enough to cover the costs of taking the position. The cost of taking the position effectively increases as the gap between the LGC spot price and the $65 shortfall charge increases because the shortfall charge is not tax deductible until redeemed. The estimated LGC balance at the end of the 2025 compliance year of 20.6 to 21.1 million assumes for simplicity that liable entities do not take shortfall. Given the observed decline in LGC prices, it will be interesting to see whether any further material shortfall is taken.
In a market where LGC prices are expected to fall over time, entities will typically surrender refunds in the last year possible, although this can vary based on financial positions. Liable entities usually lock in the prices they will pay for the LGCs they need to surrender in the future through power purchase agreements (PPAs) and futures contracts. This means they are less likely to be affected by spot price uncertainty.
The table below shows the breakdown of LGCs eligible for shortfall charge refunds by compliance year at the end of Q1 2025. On current expected price paths, early redemption of shortfall charges may be less likely. In that case the 4.1 million LGCs from 2023 and the 3.8 million from 2024 would be surrendered in 2026 and 2027, respectively.
| 2022 | 2023 | 2024 | Total | |
|---|---|---|---|---|
| LGCs Eligible | 4,093,817 | 4,072,318 | 3,837,613 | 12,003,748 |
| Refund Eligible | $266,098,105 | $264,700,670 | $249,444,845 | $780,243,620 |
Looking beyond the current shortfall vintages, since the start of Q3 2024, the price difference between Cal27 and Cal28 futures and the LGC spot price has tightened. This makes taking a shortfall position for RET compliance over those periods less financially attractive, other things equal.
Large-scale generation certificate (LGC) spot price
Note: This figure is not interactive.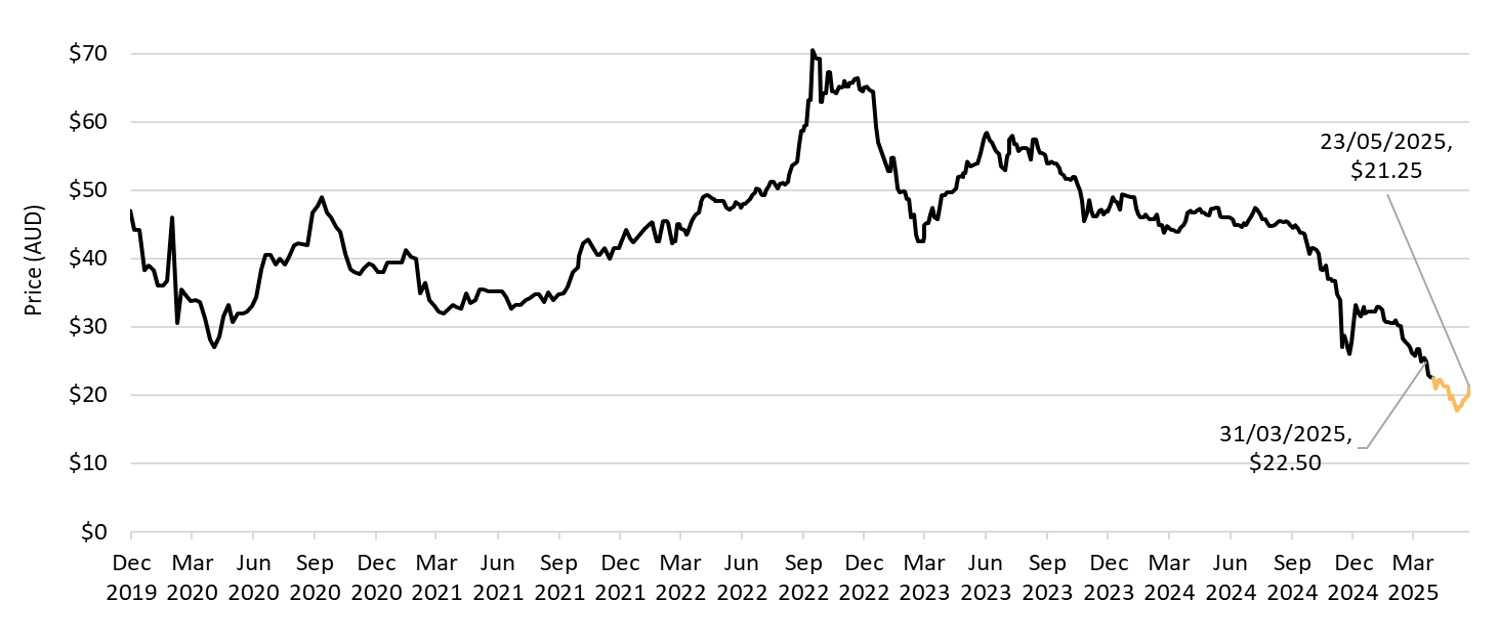
Description
This figure shows the daily closing LGC spot price from 1 December 2019 to 23 May 2025. The closing spot price on 23 May was $21.25 and the closing spot price as of the end of Q1 2025 was $22.50 on 31 March.
Small print
Spot price data is compiled from trades reported by CORE markets and may not be comprehensive. Prices are shown from 1 December 2019 to 23 May 2025.
Large-scale generation certificate (LGC) reported spot and forward prices
Note: This figure is not interactive.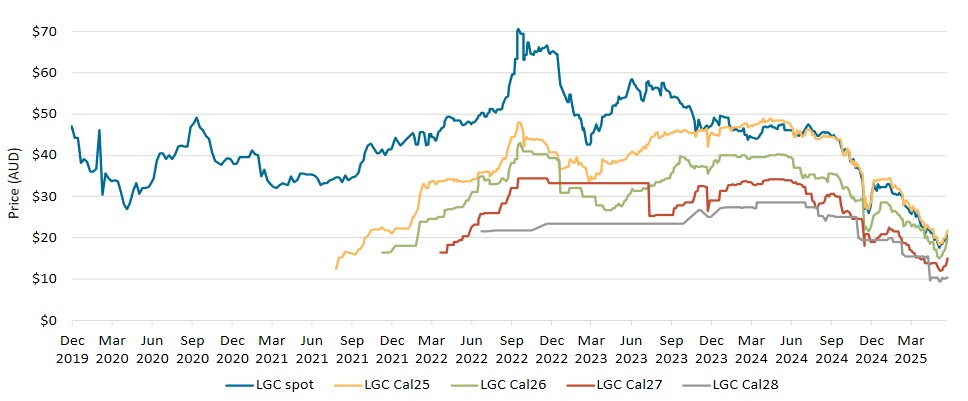
Description
This figure shows the daily closing LGC spot price and calendar year forward prices for Cal25, Cal26, Cal27 and Cal28 from 1 December 2019 to 23 May 2025.
Small print
For example, Cal25 is the 2025 calendar year, where an agreement is made to buy/sell LGCs at a specified price in 2025. Pricing data is compiled from trades reported by CORE markets and may not be comprehensive. Prices are shown from 1 December 2019 to 16 May 2025.
Approvals lower in Q1 but pipeline healthy
In Q1 2025, 0.3 GW of renewable capacity was approved to generate LGCs. This included the approval of Goyder South Wind Farm, adding 196 MW of capacity at the end of the quarter.
- In Q2, the 520 MW Stubbo solar farm, the 346 MW Wollar solar farm, and the 450 MW Clarke Creek wind farm have been approved so far. These three power stations are over four times the total approved capacity in Q1 2025.
- As of 31 May, there is about 1.2 GW of large-scale capacity under assessment by the CER.
In the Q4 2024 QCMR we estimated an additional 2.7 to 3.1 GW would be approved in 2025. So far, around 3.0 GW are already approved or under assessment, indicating a healthy pipeline. On this basis, we expect to exceed the 2.7 GW lower bound of our conservative range for additional large-scale renewable capacity.
Approved large-scale wind and solar capacity in gigawatts (GW)
Note: This figure is not interactive.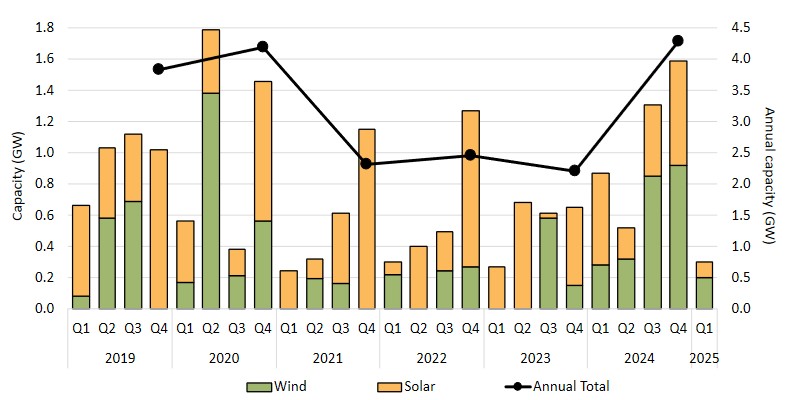
Description
This figure shows the capacity of large-scale wind and solar power stations that were approved by the Clean Energy Regulator LGCs per quarter from 1 December 2019 to 31 March 2025. This figure also shows the total capacity that was approved per year during that time as a line.
This figure is interactive. Hover over/tap each segment to see the capacity. Hover over/tap on each circle to see the annual total. Click/tap on the items in the legend to hide/show data in the figure.
Small print
Solar and wind hybrid projects are grouped under the solar category. Totals may not sum due to rounding.
Supply and demand for LGCs, and implications for price and investment
The Large-scale Renewable Energy Target (LRET) has been successful in incentivising investment in large-scale renewable energy projects, with over 30 GW of large-scale generation capacity added to the grid since 2001.
Strong investment in large-scale renewable energy over the past 4 years has seen annual LGC creations grow to an expected 54 to 57 million this year. The demand for these certificates comes from liable entities (largely electricity retailers) meeting their share of fixed annual scheme targets, plus demand from other entities for voluntary or other purposes (‘non-RET’ demand). The market is now confident that annual supply, in combination with increasing residual LGC volumes in the certificate registry, can readily account for expected demand. This has resulted in downward pressure on LGC prices as expected.
Sources of supply and demand
In 2015, the annual scheme target was set to 33,000 GWh per year from 2021 to 2030. This means annual liabilities are essentially stable to scheme end 2030. However, the supply of LGCs grows each year because all new large-scale renewable generation approved by the CER can create certificates. From Q1 2021 to Q1 2025, an additional 11.6 GW of wind and solar capacity has been added to the grid, representing 38% of all large-scale renewable energy generation capacity added since the introduction of the LRET.
Non-RET surrenders started in 2017 with just 33 entities surrendering fewer than 1 million LGCs. This has grown to nearly 200 entities surrendering more than 10 million LGCs last year. There are 3 categories of non-RET demand:
- non-RET (voluntary): private enterprises surrendering LGCs to meet environmental, social, and governance targets
- non-RET (compliance): private enterprises surrendering LGCs as required by local, state, or territory regulation or legislation
- non-RET (government): government entities surrendering LGCs to meet renewable energy or other climate targets.
Private voluntary demand is the largest source of non-RET demand, growing to represent 14% of all annual LGC demand in 2024. There is potential for substantial further growth in demand including from mandatory climate risk disclosures, National Greenhouse and Energy Reporting voluntary market-based scope 2 emissions reporting, and observed reductions in LGC prices. One estimate from ACIL Allen in 2024 projected annual voluntary LGC demand to grow from its current level of around 10 million to 26 million in 2030. Given the substantial potential upside for voluntary demand, it will be interesting to see at what price the increasing supply is matched by increasing demand. Non-RET demand is discussed further in Box 2.
Shortfall surrenders can also be a significant source of demand, for example representing 15% of demand in 2024. As discussed above, subject to certain conditions, liable entities can pay a ‘shortfall charge’ and surrender LGCs within 3 years to claim a refund of the charges. These surrenders do not increase cumulative compliance demand over the life of the scheme but rather can shift the demand across time.
The relative size of recent supply and demand are shown in the figure below. In the earlier years of the decade, the balance between LGC supply and demand remained tight due to growth in voluntary LGC demand, and the surrender of LGCs for shortfall refunds. These demand factors allowed a high LGC price to be maintained despite the fixed annual compliance target.
Potential impacts
In the short term, the reduction in LGC prices is not anticipated to have a significant impact on investment decisions by project developers. Renewable energy projects typically sign PPAs with third parties prior to reaching a final investment decision (FID). PPAs hedge projects from price risk in the open LGC market, meaning the effects of the price downturn on their finances will be minimal.
Market intelligence also suggests that developers are not concerned about the decline in LGC prices over longer horizons: their financial planning is based on assumptions of low certificate prices, and a suite of other policies such as the Capacity Investment Scheme (CIS) and state-based schemes are supporting investment.
Description
This figure shows the relative sizes of supply and demand per year for LGCs between 2019-2024 with an estimated figure for 2025. The figure represents supply as line showing LGC validations. The figure represents demand in stacked columns containing the following figures: the RPP target and non-RET cancellations in three categories (voluntary, compliance, and government).
This figure is interactive. Hover over/tap each segment to see the number of LGCs. Hover over/tap along the line to see the annual total. Click/tap on the items in the legend to hide/show data in the figure.
Small print
LGC validations represents supply. Demand comprises of RET demand and non-RET LGC cancellations segregated by demand source. See below for classifications. Estimated validations for 2025 shown on this chart reflect the mid-point of the estimated range of 54 to 57 million LGCs.
This classification system is uniform across Australian carbon credit unit (ACCU) and LGC cancellations.
Covered activities for each classification
Voluntary demand
Cancellations made against voluntary certification programs such as Climate Active and any sort of organisational emissions or energy targets.
Government demand
Cancellations by or on behalf of government entities. For example to offset emissions from vehicle fleets or meet voluntary emissions reduction targets.
Compliance demand
Cancellations made by private organisations and corporations for compliance or obligations against municipal, local, state and territory government laws, approvals, or contracts. For example to meet Environmental Protection Authority requirements."
2025 may be a record for capacity reaching FID despite a modest Q1
In Q1 2025, 2 projects with a total of 0.4 GW of capacity reached final investment decision (FID): the 280 MW Bungama Solar Farm Stage 3 near Port Pirie and the 106 MW Lancaster Solar Farm west of Shepparton. The Bungama Solar Farm also includes a 250 MW/500 MWh battery. This compares to 1.4 GW of capacity that reached FID in Q4 2024. As discussed in the Q4 2024 QCMR, the timing of FID and first generation for large renewables projects are inherently lumpy.
The CIS is continuing to support investment in large-scale renewable energy projects. Successful Tender 1 projects remain subject to the signing of a Capacity Investment Scheme Agreement (CISA) with the Australian Government. Revenue underwriting agreements available to projects supported through finalised CIS contracts are expected to increase the likelihood of reaching financial milestones such as FID in less time. Given the sizeable capacity of successful bids in Tender 1, total capacity reaching FID in 2025 could be around 6 GW or potentially more.
Two hybrid solar-storage projects with a combined generation capacity of 520 MW were among the 4 successful storage projects in in CIS Tender 2 – Wholesale Electricity Market (WEM) Dispatchable Capacity – 120 MW from Waroona Renewable Energy Project, and 400 MW from Boddington Giga Battery.
Stage B of CIS Tender 3 – National Electricity Market (NEM) Dispatchable, seeking 4 GW of projects, opened on 20 March 2025 and closed on 1 May 2025, while Stage A of CIS Tender 4 – NEM Generation, seeking 6 GW, closed on 18 February. The outcome of CIS Tender 3 is scheduled to be announced in Q3 2025, while stage B of CIS Tender 4 opened on 5 May and will close on 5 June with the outcome scheduled to be announced in October 2025. To date, all CIS tenders have been oversubscribed, indicating a strong pipeline of renewable energy projects. This trend is expected to continue for future tender rounds.
Description
This figure shows the capacity of large-scale renewable power stations to reach a final investment decision in each quarter between the period 1 January 2016 to 31 March 2025. This figure also includes the four-quarter rolling average of the capacity as a line.
This figure is interactive. Hover over/tap each bar to see the capacity. Hover over/tap along the line to see the rolling average. Click/tap on the items in the legend to hide/show data in the figure.
Small print
The Clean Energy Regulator tracks public announcements. Data may be incomplete and may change retrospectively. Totals may not sum due to rounding.
Data as at 30 June 2024.
Strong start to non-RET demand in Q1
LGC holdings were 25.4 million at the end of the quarter, an increase of 20% from the Q1 2024 total of 21.1 million LGCs. Around half of this increase has been driven by non-RET (voluntary) entities. These holdings ended Q1 2025 at 7.4 million and make up 29% of total holdings, up from 25% in the same quarter last year.
Holdings in the non-RET (compliance) also grew significantly, rising by 45% (1.1 million LGCs) compared to the same quarter last year. These entities are private enterprises who are required to surrender LGCs to comply with regulatory requirements set by local or state and territory governments. Surrenders by non-RET (compliance) entities can be lumpy year to year as some entities conduct multi-year surrenders.
Description
This figure shows the volume of LGC holdings in Renewable Energy Certificate (REC) Registry accounts per quarter by market participation category for the period 1 January 2019 to 31 March 2025. The categories are as follows: liable entity, power station, non-RET (voluntary), non-RET (compliance), non-RET (government), intermediary, and other.
This figure is interactive. Hover over/tap each data point to see the number of LGCs. Click/tap on the items in the legend to hide/show data in the figure.
Small print
Holdings are for registered LGCs as at the end of the quarter and exclude any pending transactions. Accounts are categorised according to their primary role or function based on transaction patterns and the name of the account. An account's category is subject to change. Totals may not sum due to rounding.
Category definitions
Liable entity
Account holder is a liable entity.
Power station
Account holder has created LGCs.
Non-RET (voluntary)
Account holder has surrendered LGCs voluntarily. This includes accounts labelled as 'GreenPower' in the REC registry.
Non-RET (compliance)
Account holder has surrendered LGCs voluntarily for non-RET compliance reasons (for example, desalination plants) or the account holder is a safeguard entity or related to a safeguard entity.
Non-RET (government)
Account holder has surrendered LGCs voluntarily and is a government entity.
Intermediary
Account holder has transacted/received over 1 million LGCs and does not fit into any of the other categories.
Other
Account holder does not fit into any of the other categories."
There were 2.7 million LGCs surrendered for non-RET purposes in Q1 2025, with 2 million coming from non-RET (voluntary) accounts. This represents an 18% year-on-year increase compared to Q1 2024. As discussed in the Q4 2024 QCMR, we expect significant voluntary surrenders in Q3 2025, and an estimated 12.5 to 15 million total surrenders in 2025. Box 2 explores 2024 voluntary surrender and potential responses to lower LGC prices.
The CER will continue to monitor non-RET demand over 2025 and provide further analysis of this market and updated estimates of total non-RET demand throughout the year.
Description
This figure shows the volume of non-RET LGC cancellations per quarter by demand source for the period 1 January 2019 to 31 March 2025. The demand sources have been categorised as follows: voluntary, government, and compliance.
This figure is interactive. Hover over/tap each bar to see the number of LGCs cancelled. Click/tap on the items in the legend to hide/show data in the figure.
Small print
This classification system is uniform across Australian carbon credit unit (ACCU) and LGC cancellations.
Covered activities for each classification
Voluntary demand
Cancellations made against voluntary certification programs such as Climate Active and any sort of organisational emissions or energy targets.
Government demand
Cancellations by or on behalf of government entities. For example to offset emissions from vehicle fleets or meet voluntary emissions reduction targets.
Compliance demand
Cancellations made by private organisations and corporations for compliance or obligations against municipal, local, state and territory government laws, approvals, or contracts. For example to meet Environmental Protection Authority requirements."
Renewable Electricity Guarantee of Origin Scheme to start this year
The REGO scheme will certify renewable electricity from an expanded set of sources starting in the second half of 2025. REGO is one part of the Guarantee of Origin (GO) scheme which also includes the Product Guarantee of Origin scheme commencing with hydrogen from electrolysis. REGO certificates will be tradeable like LGCs. REGOs will also provide additional value as certificates will have greater detail on when the certified electricity was generated. There is already market interest for this capability. Unlike the RET, there are no annual scheme targets.
There will be 3 categories of eligible REGO facility: renewable electricity facilities (power stations that generate electricity from an eligible renewable source), energy storage systems (facilities capable of storing and dispatching electricity), and aggregated systems (multiple generation or storage systems under a single facility). In future, aggregated systems may be able to certify aggregated small-scale systems once rules are legislated. Renewable power stations that are already registered under the LRET may register in the REGO scheme as accredited power station facilities, a sub-type of renewable electricity facility.
Renewable electricity facilities and energy storage system facilities will be able to register from scheme commencement. Aggregated systems will be available for registration once rules are available. During the period to 2030 that both schemes are operational, accredited power station facilities, which are already registered in LRET, will be able to choose to create either LGCs or REGOs for each unit of electricity. It is expected LGCs will be preferred over REGOs unless the buyer of the electricity requires time stamping as LGCs can be used for both RET obligations and voluntary surrenders. The CER will cover REGO market dynamics in the QCMR from scheme commencement.
In the National Electricity Market, the LRET and REGO schemes will operate in the context of overall wholesale market settings. Appropriate settings to promote investment in firmed renewable generation and storage capacity following the conclusion of the Capacity Investment Scheme tenders in 2027 are currently under expert review. The NEM wholesale market settings review panel will produce recommendations for consideration by Energy Ministers through the Energy and Climate Ministerial Council.