
Large-scale renewable electricity
On this page
- Market dynamics
- 2025 another strong year for large-scale approvals
- 2025 ends on a high note for final investment decisions
- Renewable Electricity Guarantee of Origin underway; large-scale storage pipeline data under development
- Non-RET demand surges from voluntary renewable commitments
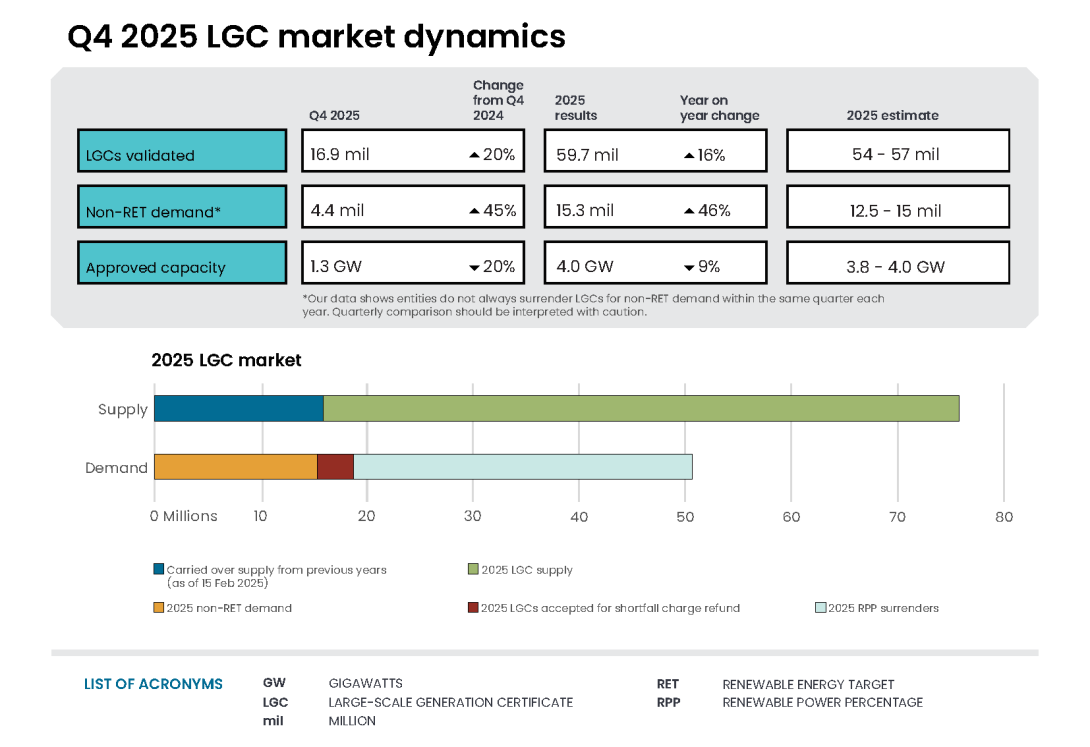
Market dynamics
| Supply | Demand | |
|---|---|---|
| Supply carried over from previous years (as of 15 Feb 2025) | 15.9 m | - |
| LGC supply (Q1-Q4 2025) | 59.7 m | - |
| Non-RET demand (Q1-Q4 2025) | - | 15.3 m |
| 2025 RPP surrenders | - | 32.0 m |
| LGCs accepted for shortfall charge refund (Q1-Q4 2025) | - | 3.4 m |
| Estimated balance as of 16 Feb 2026^ | 24.8m | |
Notes:
- There is a total of 3.9 million LGCs in shortfall that are eligible for shortfall refunds to be claimed, representing $250.8 million in consolidated revenue as of 16 February 2026. This excludes LGCs in shortfall from entities under administration.
- ^Sum of all supply items, less the sum of all demand items. Figures may not sum due to rounding.
LGC creations are driven by the generation of renewable electricity by accredited large-scale power stations. One LGC is created for each MWh of eligible renewable electricity. Generation by power stations depends on installed capacity, weather, and operational factors like repairs, maintenance, and curtailment.
A record 16.9 million LGCs were created in Q4 2025, bringing total creations for the year to a record 59.7 million. This was above our projected 54-57 million and was an 8.2 million increase in creations compared to 2024. Box 2.1 summarises 2025 outcomes for the RET. As usual, the RET content in the Q4 QCMR functions as the basis for the annual Renewable Energy Target’s administrative report.
AEMO’s Q4 2025 Quarterly Energy Dynamics report noted that renewables supplied 51% of overall electricity supply in the NEM in Q4 2025, marking the first quarter that average renewables penetration in the NEM exceeded 50%. This increase was driven by increased wind and solar output. Increased solar output reflected continued strength in new solar capacity, partially offset by curtailment. Battery discharge also recorded the strongest percentage growth of any fuel type between Q4 2024 and Q4 2025, as new systems entered the NEM, increasing output by 198% year-on-year. The report notes that increased battery contributions to the NEM’s electricity supply, as well as increased wind generation, has reduced reliance on gas and hydroelectricity generation during the evening demand peaks, lowering wholesale electricity prices across the network.
Wind power stations generated the most LGCs of any technology type, with 36.1 million, or 61% of creations. Wind also had the largest increase in total LGC creations compared to 2024, generating an additional 5.5 million LGCs over the year. The robust performance of wind in 2025 compared to 2024 is attributable to the development and commissioning of new wind power stations over the year, as well as the absence of the wind drought conditions experienced in some regions in autumn and winter 2024.
Solar generation also had a strong 2025, with LGC creations increasing by 3.1 million to 20.1 million. The largest proportional increase in annual LGC creations was from biomass, which saw a 27% increase in creations from 2.2 million in 2024 to 2.8 million in 2025.
Description
This figure shows the number of LGCs validated by technology type over time.
This figure is interactive. Hover over/tap each segment to see the quarterly number of LGCs validated. Hover over/tap along the line to see the annual total of LGCs validated. Click/tap on the items in the legend to hide/show data in the figure.
The high LGC creations in 2025 reflect generation from a now large stock of renewable capacity as well as ongoing strength in the development of large-scale renewables; the former in particular is due to the success of the LRET. Given the fixed target of 33,000 GWh of generation, however, this strength has resulted in a higher supply of LGCs than the market demands. The only sources of growth in demand for LGCs until the end of the scheme are for non-RET surrenders and shortfall refunds. Non-RET demand has seen significant growth over the last several years, but it has not been sufficient to match the increasing LGC supply.
Strong LGC creations in 2025 continued the oversupply of LGCs, putting downward pressure on prices. Over Q4 2025, the LGC spot price declined from $11.25 to end the year at $6.25. Over the year, the spot price declined by 81% from its 1 January 2025 price of $32.25. Forward prices across all vintages from 2025 to 2028 saw similar declines over the course of 2025.
The LGC spot price has continued to decline in early 2026, dropping to $4.25 as of 13 February 2026. Forward prices for all vintages 2026 to 2029 have also seen ongoing downward movement.
Large-scale generation certificate (LGC) reported spot and forward prices
Note: This figure is not interactive.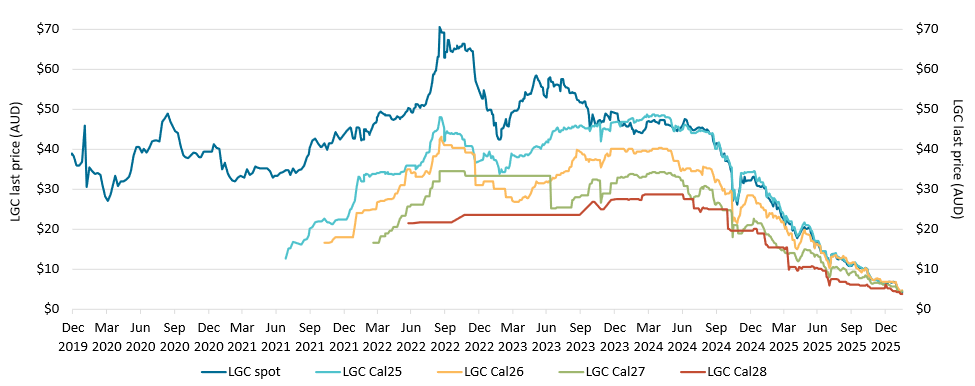
Description
This figure shows the daily closing LGC spot price and calendar year forward prices over time.
Small print
For example, Cal25 is the 2025 calendar year, where an agreement is made to buy/sell LGCs at a specified price in 2025. Pricing data is compiled from trades reported by CORE markets and may not be comprehensive. Prices are shown from December 2019 to 13 February 2026.
As outlined in previous QCMRs, the decline in LGC prices is unlikely to materially impact on large-scale renewable energy investment. Investment decisions are increasingly being made with little consideration to LGC prices, as developers have anticipated lower LGC prices in their business cases. Further, given the end of the RET scheme in 2030, new projects will have few years in which to generate LGCs, further reducing the relevance of LGC prices to new projects’ cashflows over their useful lives. The CIS is currently the primary Commonwealth incentive for new large-scale generation projects, and the commencement of the REGO scheme on 3 November 2025 is expected to further shift the focus of developers away from the LRET.
The deadline for 2025 LGC surrenders was 16 February 2026. A total of 32.0 million LGCs were surrendered by liable entities, with all entities providing their energy acquisition statements for 2025 on time. A total of 1.8 million LGCs from 4 entities went into shortfall, with a further 11 entities carrying forward a shortfall of 0.2 million LGCs into the 2026 compliance year.
On 5 February 2026, the RPP for 2026 was set at 16.67%, slightly down from 17.91% in 2025. The RPP is set by the Minister for Climate Change and Energy each year and is set so that LGC surrenders in the year meet the LRET’s annual legislated target for renewable electricity, which is 33,000 GWh each year from 2021 to 2030.
The reduction in the RPP primarily reflects LGC liabilities in 2025 being higher than required for meeting the LRET target of 33 million LGC surrenders. This has resulted in a negative cumulative adjustment to the RPP for 2026, reducing the LGC surrender requirements for liable entities in 2026 from what they otherwise would have been. An increase in wholesale electricity purchases by liable entities also contributed to the lower percentage in 2026.
LGC creations in 2026 are expected to continue to increase. Assuming normal weather conditions, we anticipate that 64-66 million LGCs will be created in 2026. This should comfortably meet 2026 LRET obligations, shortfall refunds, and non-RET demand.
There is also further potential upside with the increased storage capacity entering Australia’s electricity system through both large-scale batteries and the Cheaper Home Batteries Program. Increased storage capacity could facilitate reduced economic and network curtailment of renewables, as excess electricity generated from renewables can be used to charge batteries. The market is therefore expected to remain in oversupply through 2026 and likely until the end of the RET in 2030.
The successful LRET scheme has entered its final 5 years of operation. LGCs can be created for eligible generation occurring up to 31 December 2030. Following the final surrender deadline of 14 February 2031, all liable entity positions will be finalised.
2025 another strong year for large-scale approvals
Large-scale approvals kept up momentum through 2025. Large-scale generation capacity of 1.3 GW was approved in Q4, bringing total approvals in 2025 to 4.0 GW. This is down slightly from the record 4.3 GW approved in 2024. Most approvals were in NSW (1.8 GW) and Queensland (1.5 GW), with the 520 MW Stubbo Solar Farm (NSW) the single largest power station approved in 2025.
Of the 4 GW of large-scale generation capacity approved in 2025, 3 GW came from solar power stations. This marks the biggest year for large-scale solar approvals on record, beating the previous record of 2.5 GW set in 2018. 2025 was also the first year on record with multiple quarters seeing more than 1 GW of large-scale solar approvals, with 1 GW being approved in Q2, and 1.3 GW being approved in Q4.
Major power stations approved in Q4 2025 include:
- Aldoga Solar Farm (485 MW, QLD)
- Glenellen Solar Farm (260 MW, NSW)
- Carwarp Solar Farm (171 MW, VIC)
- Munna Creek Solar Farm (150 MW, QLD)
- Gunsynd Solar Farm (111 MW, QLD)
Description
This figure shows the capacity of large-scale wind and solar power stations approved by the Clean Energy Regulator to generate large-scale generation certificates over time.
This figure is interactive. Hover over/tap each segment to see the capacity per quarter. Hover over/tap along the line to see the annual total. Click/tap on the items in the legend to hide/show data in the figure.
Small print
Solar and wind hybrid projects are grouped under the wind category. Totals may not sum due to rounding. Data, including for earlier years, can be found on Large-scale renewable energy data and Historical large-scale renewable energy supply data.
Another strong year for power station approvals is expected in 2026. As of 31 December 2025, 1.2 GW of large-scale capacity was under assessment by the CER, suggesting that strong approvals may be seen in the first half of 2026. Based on our generation project pipeline, and the typical timeframes for projects to reach approval from FID or the start of construction, we anticipate that between 3.5 and 4.5 GW of large-scale capacity will be approved under the LRET scheme in 2026.
However, when large projects reach their first generation is subject to a range of uncertainties, such as weather conditions, workforce availability, and global supply chains. We will monitor the progress of project construction and applications for approval throughout 2026 and provide updates on our projection throughout the year.
2025 ends on a high note for final investment decisions
FID in 2025 totalled 2.1 GW. This is the lowest figure for FID in recent years, despite a robust 960 MW reaching FID in Q4 2025.
FID is highly variable year-to-year. Both solar and wind saw significant declines in FID in 2025 compared to 2024 but remained within historical ranges. Solar projects reaching FID totalled 1.4 GW, the lowest figure in recent years, below the previous record low of 1.5 GW in 2021. Wind projects reaching FID in 2025 totalled 685 MW.
Major projects reaching FID in Q4 2025 include:
- Blind Creek Solar Farm (300 MW, NSW)
- Carmody’s Hill Wind Farm (247 MW, SA)
- Delburn Wind Farm (200 MW, VIC)
- Waddi Wind Farm (108 MW, WA)
- King Rocks Wind Farm (105 MW, WA)
Carmody’s Hill Wind Farm was also the first project successful under Tender 4 of the CIS to reach FID.
Description
This figure shows the capacity and four quarter rolling average of large-scale renewable power stations to reach a final investment decision over time.
This figure is interactive. Hover over/tap each bar to see the committed capacity per quarter. Hover over/tap along the line to see the rolling average of committed capacity. Click/tap on the items in the legend to hide/show data in the figure.
Small print
The Clean Energy Regulator tracks public announcements. Data may be incomplete and may change retrospectively. Totals may not sum due to rounding.
Estimating FID is difficult due to the inherent year-to-year variability in FID. Given the key role of the CIS in incentivising new generation, total FID is dependent on the progress of CIS projects.
As of 31 December 2025, there was a combined 12 GW of potential future generation capacity from projects successful under one of the first 4 CIS tenders, excluding those that have already reached FID or that have been approved under the LRET. Under the assessment criteria of the CIS, projects should show a credible pathway to achieve a commercial operation date prior to 31 December 2030.
Based on the total pipeline (CIS-supported and other) of projects under development as of 31 December 2025, and the typical timeframe it takes projects to reach FID from the announcement of partial financing or planning approval, between 6 and 16 GW of generation capacity could reach FID by the end of 2027. For context, the total capacity of projects that have either reached partial financing or that have received planning or environmental approval under Commonwealth or state/territory legislation as of 31 December 2025 is 21.2 GW.
Renewable Electricity Guarantee of Origin underway; large-scale storage pipeline data under development
With the commencement of the REGO scheme on 3 November 2025, large-scale energy storage facilities have entered our schemes for the first time. To support the REGO scheme, as well as providing greater visibility of the transformation of Australia’s electricity system to renewables and storage, we are developing a large-scale energy storage pipeline dataset.
Like our current large-scale generation pipeline, the large-scale energy storage pipeline will track large-scale storage projects as they progress from development to operation, including registration under the REGO scheme for projects that participate.
We will provide further updates throughout 2026 on the development of our large-scale storage pipeline, including details on when the pipeline will be made publicly available on our website.
AEMO’s Quarterly Energy Dynamics report for Q4 2025 highlights the rapidly expanding role of storage in the NEM. Battery capacity and utilisation continued to increase, with record levels of grid‑scale battery discharge helping to moderate wholesale prices and reduce the incidence of high-priced intervals. Voluntary curtailment increased in Q4 as some generators reduced output during low‑price periods, reflecting commercial decisions that consider multiple revenue streams – including wholesale prices and certificate markets such as LGCs – and highlighting the role for additional storage to absorb surplus renewable generation.
The CER has begun receiving and approving applications under the REGO scheme. On 30 January 2026, the first renewable electricity facility was registered under the REGO scheme: a 166 kW solar facility in NSW. Registered renewable electricity facilities and persons are available through the Guarantee of Origin Register.
Non-RET demand surges from voluntary renewable commitments
Total LGC holdings increased by 12.2 million over Q4 2025 to reach 56.1 million by the end of the year. This is an increase of 9.7 million compared to the end of 2024. Holdings by intermediaries and power stations increased the most over 2025, growing by 3.7 million and 3.1 million, respectively. Holdings by liable entities are 0.2 million lower at the end of 2025 compared to the end of 2024 but rose in early 2026 as liable entities prepared for the 2025 LGC surrender deadline on 14 February 2026.
Description
This figure shows LGC holdings in Renewable Energy Certificate (REC) Registry accounts by market participation category over time.
This figure is interactive. Hover over/tap each data point to see the LGC holdings in millions. Click/tap on the items in the legend to hide/show data in the figure.
Small print
Holdings are for registered LGCs as at the end of the quarter and exclude any pending transactions. Accounts are categorised according to their primary role or function based on transaction patterns and the name of the account. An account's category is subject to change. Totals may not sum due to rounding.
Category definitions
Liable entity
Account holder is a liable entity.
Power station
The account holder has created more LGCs than it has surrendered.
Non-RET (voluntary)
The majority of LGCs surrendered by the account holder have been surrendered voluntarily, or the account is labelled as 'GreenPower' in the REC registry.
Non-RET (compliance)
The majority of LGCs surrendered by the account holder have been surrendered voluntarily for non-RET compliance reasons (for example, desalination plants).
Non-RET (government)
The majority of LGCs surrendered by the account holder have been surrendered voluntarily for a government entity.
Intermediary
Account holder has transacted/received over 100,000 LGCs and does not fit into any of the other categories.
Other
Account holder does not fit into any of the other categories.
In Q4 2025, 4.4 million LGCs were surrendered for non-RET purposes, bringing total non-RET surrenders in the year to 15.3 million. This exceeded our expectations of 12.5 to 15 million and is a 4.8 million increase compared to 2024. This is the largest year-to-year increase in non-RET surrenders on record, exceeding the previous record increase of 3.3 million in 2020.
The largest increase in non-RET LGC surrenders came from voluntary surrenders, which increased by 4 million from 6.9 million in 2024 to 10.9 million in 2025. The increase in voluntary surrenders reflects many large entities reaching corporate goals for 100% renewables by 2025. Many of these entities were surrendering for the 2024-25 financial year. Some entities with targets for the 2025 calendar year may be expected to make their surrenders in 2026, which will further support non-RET demand for LGCs.
Description
This figure shows non-RET LGC cancellations by demand source over time.
This figure is interactive. Hover over/tap each bar to see the number of LGCs cancelled per quarter. Hover over/tap along the line to see the annual total of LGCs cancelled. Click/tap on the items in the legend to hide/show data in the figure.
Small print
This classification system is uniform across Australian carbon credit unit (ACCU) and LGC cancellations.
Covered activities for each classification
Voluntary demand
Cancellations made against voluntary certification programs such as Climate Active and any sort of organisational emissions or energy targets.
Government demand
Cancellations by or on behalf of government entities. For example to offset emissions from vehicle fleets or meet voluntary emissions reduction targets.
Compliance demand
Cancellations made by private organisations and corporations for compliance or obligations against local or state and territory government laws, approvals, or contracts. For example to meet Environmental Protection Authority requirements.
Industry intelligence indicates increased interest in LGCs by electricity retailers on behalf of their customers due to the lower LGC prices, which may incentivise further non-RET demand growth. NGER reporters may also increase their voluntary surrenders to offset scope 2 emissions.
Increased scrutiny of greenwashing is also contributing to companies being more cautious about making net‑zero or other environmental claims without unambiguous evidence. This may further support LGC demand from voluntary surrenderers as companies look to back up their environmental claims.
We expect 2026 to continue the trend of increasing non-RET LGC surrenders each year. We currently expect that between 16 and 19 million LGCs will be surrendered for non-RET purposes in 2026. We will monitor non-RET surrenders throughout the year and provide updates to our projection in future QCMRs.