Large-scale renewable electricity
On this page
- Market dynamics
- Q2 approvals subdued
- Solar dominating large-scale renewable investment
- New record for non-RET surrenders
Market dynamics
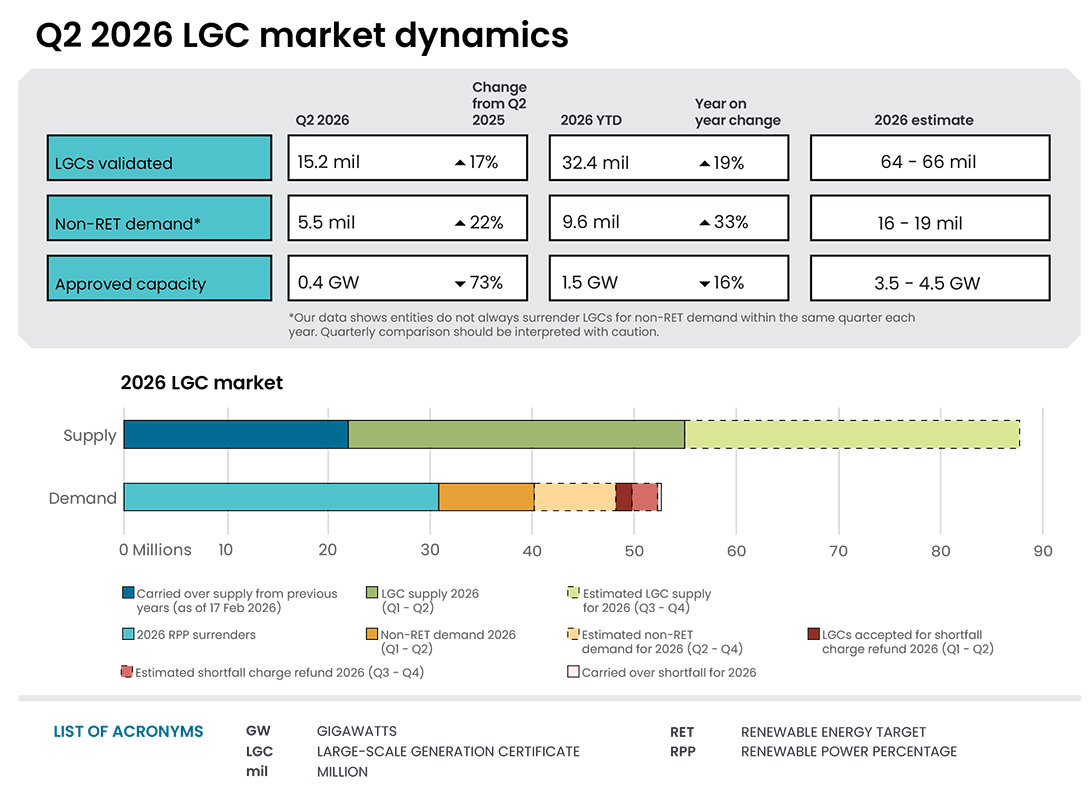
| Supply | Demand | |
|---|---|---|
| Supply carried over from previous years (as of end of 2025 compliance period: 17 Feb 2026) | 22.2 m | - |
| LGC supply (Q1 to Q2 2026) | 32.4 m | - |
| Estimated LGC supply (Q3 to Q4 2026) | 31.6 m to 33.6 m | - |
| Non-RET demand (Q1 to Q2 2026) | - | 9.6 m |
| Estimated non-RET demand (Q3 to Q4 2026) | - | 6.4 m to 9.4 m |
| 2026 renewable power percentage surrenders (before any shortfall) | - | 30.7 m |
| LGCs accepted for shortfall charge refund (Q1 to Q2 2026) | - | 1.7 m |
| Estimated shortfall charge refund (Q3 to Q4 2026) | - | 2.1 m |
| Carried over shortfall for 2026 (less than 10% of liability) | - | 0.2 m |
| Estimated balance as of end of 2026 compliance period: 16 Feb 2027^ | 32.5 m to 37.5 m | |
Notes:
- There is a total of 4.9 million LGCs in shortfall that are eligible for shortfall refunds to be claimed, representing $317.6 million in consolidated revenue as of 30 June 2026. This excludes LGCs in shortfall from entities under administration.
- ^Sum of all supply items, less the sum of all demand items. This assumes no further shortfall is taken for the 2026 compliance year. Figures may not sum due to rounding.
LGC creations are driven by the generation of renewable electricity by accredited large-scale power stations. One LGC is created for each megawatt-hour (MWh) of eligible renewable electricity.
Generation by power stations depends on installed capacity, weather, and operational factors like repairs, maintenance, and curtailment.
In Q2 2026, a quarterly record of 15.2 million LGCs were created, an increase of 17% (2.3 million) compared to Q2 2025, bringing the annual total for 2026 to 32.4 million LGCs. Wind contributed to around 61% of creations with 9.3 million LGCs, up 22% from Q2 2025. Solar accounted for a further 36% of creations with 5.4 million LGCs, up 16% compared to Q2 2025. While biomass and hydroelectricity LGC creations declined compared to Q2 2025, these technologies had little influence on overall LGC supply during the quarter. Biomass contributes few LGCs due to its small scale. Most hydroelectric facilities in Australia commenced operation before 1997 and are only eligible to create LGCs for generation above their pre-1997 annual generation (baseline generation), limiting hydroelectricity’s contribution to overall LGC supply.
According to AEMO’s Q2 2026 Quarterly Energy Dynamics (QED) report, renewables accounted for 42% of generation in the NEM for Q2 2026, up from 37% in Q2 2025 and setting a record Q2 outcome. Wind generation made the largest contribution to the increase in renewable generation, with a 20% increase over the year to 4.2 GW. Utility-scale solar, hydroelectricity and small-scale solar also increased their contribution compared with Q2 2025, while coal- and gas-fired generation declined. Overall, wind accounted for 17% of NEM generation in the quarter, while utility-scale solar contributed 8% and hydroelectricity 7%. Small-scale solar accounted for a further 10% of generation. All this generation, as well as large and small-scale storage, directly or indirectly contributes to the Government’s target of achieving 82% renewable generation by 2030 (The 82% renewable electricity target: scope and calculation).
Description
This figure shows the number of LGCs validated by technology type over time.
As reported in the Q1 2026 QCMR, LGC supply continues to outpace demand, despite the consistent growth in non-RET voluntary demand. Analysis of LGC creations in previous years indicates that the LGC supply in 2026 is on track to meet the higher end of our projection of 64 to 66 million. LGC supply for the remainder of 2026 may be impacted by the current El Niño phase of the El Niño-Southern Oscillation (Effects of El Niño on supply and demand in the NEM).
Despite the persistent growth in LGC supply to the market, LGC spot and forward prices saw upward movement in mid-June, with the spot price ending the quarter at $7, up from $2.90 at the start of the quarter. All vintages up to 2030 have converged to the spot price since April 2026 and have accordingly tracked with the spot price during this quarter. The LGC spot price and forward prices across all vintages continued their upward trajectory post-quarter, with the spot price reaching $8.50 by 14 August, and forward prices remaining around the spot price.
Market intelligence suggests the rally in prices was associated with increased purchasing activity following the period of low spot prices and growing market interest in the potential implications of future electricity demand from data centres.
Recent policy discussions have increased attention on how growing data centre demand for electricity could be met through additional renewable electricity generation and procurement arrangements. In a speech on 15 July, the Prime Minister announced the Australian Government would develop national artificial intelligence standards including requirements for the next generation of large-scale data centres to underwrite new power supply. In an address to the National Press Club on 5 August, the Minister for Climate Change and Energy announced the Australian Government would use the REGO scheme to drive investment in new renewable energy. The Australian Government will work with state and territory governments to develop consistent mandatory standards for data centre energy, water and land-use, and support skills and training opportunities.
Large-scale generation certificate (LGC) reported spot and forward prices
Note: This figure is not interactive.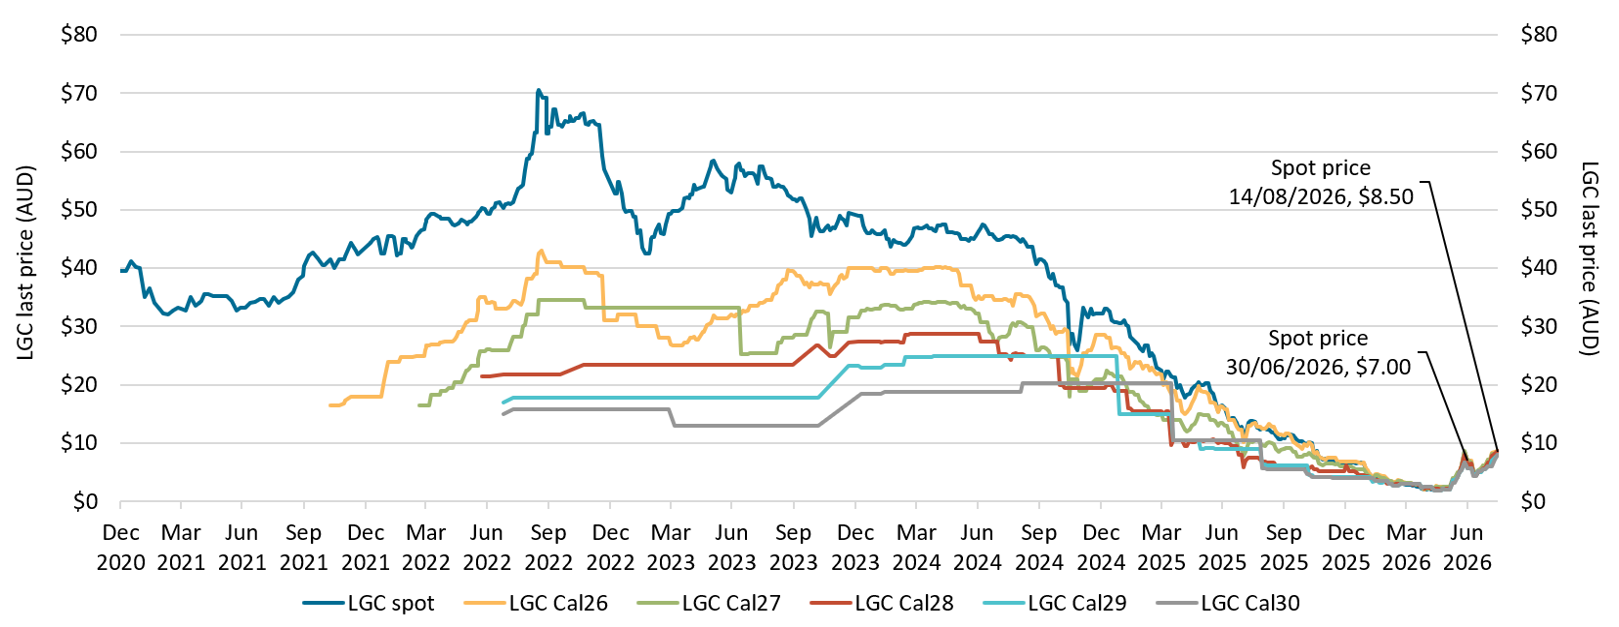
Description
This figure shows the daily closing LGC spot price and calendar year forward prices over time.
Small print
For example, Cal26 is the 2026 calendar year, where an agreement is made to buy/sell LGCs at a specified price in 2026. Pricing data is compiled from trades reported by CORE markets and may not be comprehensive. Prices are shown from 31 December 2020 to 14 August 2026.
Q2 approvals subdued
In Q2 2026, 0.4 GW of renewable capacity was approved to generate LGCs, all of which was from solar projects. Goorambat East Solar Farm contributed most of this capacity (320 MW). In total, 1.5 GW of capacity has been approved in 2026.
There is limited capacity in the power station approvals pipeline as of 30 June 2026, with only 359 MW of capacity under assessment. Approvals in future quarters will be dependent on additional power stations submitting applications to us, noting that even a small number of large power stations can cause a sharp increase in our approval pipeline capacity. Our engagement with developers indicates that at least one large power station is expecting to lodge an application for accreditation under the Large-scale Renewable Energy Target (LRET) in Q3 2026.
Description
This figure shows the capacity of large-scale wind and solar power stations approved by the Clean Energy Regulator to generate large-scale generation certificates over time.
Small print
Solar and wind hybrid projects are grouped under the wind category. Totals may not sum due to rounding. Data, including for earlier years, can be found on Large-scale renewable energy data and Historical large-scale renewable energy supply data.
Looking at the size distribution of approvals, those for mid-scale power stations with capacities between 100 kilowatts (kW) and 1 MW have fallen compared to previous years, with registrations being impacted by the decline in the LGC price over the last year. These power stations are primarily solar installations on large commercial or industrial buildings such as shopping centres, airports, or water treatment plants. In this range, a total of 80 power stations with 28 MW of capacity have been accredited under the LRET in the first half of 2026. This is around 32% lower than the average capacity accredited in H1 each year since 2021 (41 MW). The opposite is true for utility-scale power stations (those above 1 MW): 1.4 GW of capacity was approved in the first half of 2026, a 32% increase compared to the H1 average since 2021 (1.1 GW).
To help deliver customer and environmental benefits from this ‘missing middle’, on 5 August 2026, the Minister for Climate Change and Energy announced that generation projects in the 100 kW to 1 MW range will be eligible for small-scale technology certificates (STCs) under the SRES from 1 October 2026, subject to the necessary regulations being in place. To complement this policy, the Australian Energy Market Commission will also consider rule changes to make it easier for entities installing mid-scale systems to connect to the grid. Together, these measures are expected to improve investment incentives and support increased activity in this market segment. See the Consumer Energy Resources chapter for further policy detail.
Description
This figure shows the capacity of mid-scale power stations (above 100 kW and below 1 MW) approved by the Clean Energy Regulator to generate large-scale generation certificates over time.
Description
This figure shows the capacity of utility-scale power stations (above 1 MW) approved by the Clean Energy Regulator to generate large-scale generation certificates over time.
As well as accreditations under the LRET, Q2 2026 saw further facilities registered under REGO. By the end of the quarter, REGO had 3 registered facilities with a combined generation capacity of 506 MW, with a further 3 facilities pending assessment. All the registered facilities to date are facilities that have already been accredited under the LRET scheme, so this does not represent additional generation capacity being added to the grid. The scheme now includes 16 registered persons (15 under REGO and one under Product Guarantee of Origin) and 19 REGO certificates have also been registered. Information on registered persons, registered facilities, and REGO certificates are available on the Guarantee of Origin Register. We are also engaging with multiple stakeholders in relation to REGO requirements and the registration process.
The commencement of REGO on 3 November 2025 has allowed large-scale energy storage facilities to enter a CER-administered scheme for the first time. To support greater visibility of potential future participation in CER schemes and the broader transformation of Australia's electricity system, we have developed a large-scale energy storage pipeline dataset that tracks storage projects across key stages of development and operation, like our current large-scale generation pipeline. As with our generation pipeline, this data is primarily sourced from public announcements and project websites, as well as direct engagement with developers. Large-scale storage pipeline provides an overview. We will continue to expand and report on the large-scale energy storage pipeline in future QCMRs.
Solar dominating large-scale renewable investment
In Q2 2026, 1.8 GW of capacity reached FID, making it the strongest quarter since 2022 and bringing year-to-date FID capacity to 2.7 GW. As these projects that have reached FID progress through their development, we expect that they will submit applications for accreditation under the LRET scheme, which will act to boost our approvals pipeline. All this new capacity came from solar projects, making Q2 2026 the strongest quarter for solar investment since we began tracking final investment decisions.
Major projects reaching FID in Q2 2026 include:
- Turner River Solar Hub in Western Australia (690 MW)
- Guthrie’s Gap Solar Power Station in Queensland (300 MW)
- Smoky Creek Solar Power Station in Queensland (300 MW)
- Lower Wonga Solar Farm in Queensland (281 MW)
- Muswellbrook Solar in NSW (135 MW).
Of the projects that reached FID, 3 are supported by the CIS: Smoky Creek and Guthrie’s Gap power stations, and Lower Wonga Solar Farm.
Description
This figure shows the capacity of large-scale renewable power stations by fuel source to reach a final investment decision over time.
Small print
The Clean Energy Regulator tracks public announcements. Data may be incomplete and may change retrospectively. Totals may not sum due to rounding.
One important determinant of previous and future investment is the relative costs of different generation technologies. On 15 July 2026, CSIRO released the GenCost 2025–26 Final Report.
The report has found that solar and wind energy provide the lowest-cost pathway to achieving a net-zero electricity system by 2050 and are the only generation methods that are sufficiently developed to be deployed at the scale required for the 82% renewables by 2030 target.
Since 2022, the wind industry has seen rising costs and development challenges due to global inflationary pressures. The CSIRO’s capital cost estimate for wind jumped by 35% in the 2022–23 financial year and steadily grew over 2023–24 and 2024–25, while solar and battery project costs have declined over the same period. These challenges have coincided with more subdued FID for wind projects.
Despite these challenges, several indicators suggest that development activity remains healthy and that conditions for future wind investment may be beginning to improve. The 2025–26 GenCost report suggests that there may be capital cost relief for wind projects over the coming years. The CSIRO’s capital cost estimate for onshore wind had a 5% decrease in 2025–26 compared to the previous report; the first time since 2021 that the estimate has declined. While near-term cost pressures remain, the report projects a gradual decline in onshore wind capital costs through 2035.
A more favourable cost outlook may improve investment conditions for wind projects over time, although investment decisions will continue to be influenced by broader factors including financing conditions, transmission availability, and connection processes. On 20 July 2026, AEMO’s June 2026 NEM Connection Scorecard noted 12 wind projects representing 5.2 GW of generation capacity applied for NEM connectivity in the 2025–26 financial year, the highest volume of wind connection applications reported in a single year.
Description
This figure shows the capacity of large-scale battery storage facilities commencing operation over time.
New record for non-RET surrenders
A record 5.5 million LGCs were surrendered for non-RET purposes in Q2 2026. Total non-RET surrenders in 2026 to date reached 9.6 million. This is year-on-year growth of 22% from Q2 2025, where 4.5 million LGCs were surrendered. The increase was driven primarily by voluntary surrenders from non-government participants, which totalled 3.6 million LGCs and accounted for 66% of all non-RET surrenders during the quarter. These surrenders were 91% higher than in Q2 2025. The growth in voluntary surrenders indicates that corporate and other non-government entities continue to invest in renewable electricity procurement and emissions reduction activities.
Government-related surrenders totalled 1.5 million LGCs in the quarter, a 42% decline compared to the 2.5 million surrendered in Q2 2025. The decline reflects the timing of annual surrender activity by some entities meeting their renewable electricity commitments. As a result, some surrender activity that would typically have occurred in Q2 may instead occur in Q3 2026. Compliance-related surrenders contributed a further 0.4 million LGCs, up from 0.1 million in Q2 2025.
Description
This figure shows non-RET LGC cancellations by demand source over time.
Small print
This classification system is uniform across Australian carbon credit unit (ACCU) and LGC cancellations.
Covered activities for each classification
Voluntary demand
Cancellations made against voluntary certification programs such as Climate Active and any sort of organisational emissions or energy targets.
Government demand
Cancellations by or on behalf of government entities. For example to offset emissions from vehicle fleets or meet voluntary emissions reduction targets.
Compliance demand
Cancellations made by private organisations and corporations for compliance or obligations against local or state and territory government laws, approvals, or contracts. For example to meet Environmental Protection Authority requirements.
Growth in non-RET surrenders was also accompanied by an increase in first-time voluntary surrenderers. First-time participants surrendered 1.1 million LGCs in Q2 2026, accounting for almost 20% of all surrenders for the quarter. This is the highest percentage since Q2 2022, when the percentage was 35% and annual non-RET surrender volumes were roughly half of what they are today. By comparison, first time surrenderers represented around 13% of non-RET surrenders per quarter from Q1 2021 to Q2 2026.
As of the end of Q2 2026, a total of 44.4 million LGCs were held in Renewable Energy Certificate Registry (REC Registry) accounts, an increase of 25% compared to Q2 2025 when holdings totalled 35.4 million LGCs. Growth in non-RET voluntary account holdings contributed around 12 percentage points of the net increase, followed by liable entity accounts, which contributed a further 6 percentage points. Continued growth in LGC holdings is consistent with strong ongoing LGC supply.
Description
This figure shows LGC holdings in Renewable Energy Certificate (REC) Registry accounts by market participation category over time.
Small print
Holdings are for registered LGCs as at the end of the quarter and exclude any pending transactions. Accounts are categorised according to their primary role or function based on transaction patterns and the name of the account. An account's category is subject to change. Totals may not sum due to rounding.
Category definitions
Liable entity
Account holder is a liable entity.
Power station
The account holder has created more LGCs than it has surrendered.
Non-RET (voluntary)
The majority of LGCs surrendered by the account holder have been surrendered voluntarily, or the account is labelled as 'GreenPower' in the REC registry.
Non-RET (compliance)
The majority of LGCs surrendered by the account holder have been surrendered voluntarily for non-RET compliance reasons (for example, desalination plants).
Non-RET (government)
The majority of LGCs surrendered by the account holder have been surrendered voluntarily for a government entity.
Intermediary
Account holder has transacted/received over 100,000 LGCs and does not fit into any of the other categories.
Other
Account holder does not fit into any of the other categories.