
The QCMR report consolidates information across the national carbon markets that the CER administers for the June quarter (April to June) 2026. It provides information on supply and demand trends and opportunities that may inform market decisions.
On this page
Highlights
- It has been a quarter of record outcomes and policy developments across our 7 certificate-based schemes, reflecting the accelerating pace of Australia’s net zero transition.
- In the energy system, catalysts for these outcomes include Capacity Investment Scheme projects progressing, falling costs of battery storage, and the Cheaper Home Batteries Program unleashing demand for consumer energy.
- Renewable generation continued to grow, accounting for around 42% of National Electricity Market (NEM) generation and contributing to a record Q2 for large-scale generation certificate creations. While wind projects face ongoing social licence issues and cost pressures, there are some signs the latter may ease.
- Q2 2026 was a record quarter for battery installations under the Cheaper Home Batteries Program, with more than 111,000 approved batteries and 3.6 gigawatt-hours of storage capacity installed. Declining battery costs and strong consumer demand drove record uptake, with underlying demand remaining strong after incentive changes took effect on 1 May.
- Installations of new small-scale solar capacity exceeded 1 gigawatt for the first time in a quarter and are on track for a strong year. More than 80% of small-scale solar installations in April were installed alongside a battery, suggesting households accelerated combined solar and battery installations ahead of the 1 May changes to the Cheaper Home Batteries Program.
- The 5 August announcement by the Minister for Climate Change and Energy that generation projects between 100 kilowatts and 1 megawatt will be eligible for small-scale technology certificates from 1 October 2026 is expected to further improve investment activity in this sector, reducing emissions while saving businesses, schools, and farms money on energy bills.
- Consumer energy resources are having a growing impact on electricity system outcomes. Growth in distributed solar more than offset total demand growth in the NEM, contributing to the lowest average Q2 grid demand since 2020 and lowering wholesale prices.
- Participation in the Renewable Electricity Guarantee of Origin (REGO) continues to build with more certificates and renewable electricity facilities registered in Q2. Participation in REGO will be further incentivised by requirements for data centres under forthcoming legislated obligations announced by the Australian Government on 5 August.
- In other emerging markets, the Nature Repair Market registered its second project, and the Product Guarantee of Origin saw its first registered person this quarter.
- Australian carbon credit units (ACCU) issuance over the first half of 2026 is the highest on record for the first half of a calendar year, with 10.9 million ACCUs issued, 15% higher (1.4 million) than the same period last year.
- On 25 August, we published the July carbon abatement contract register with additional information related to permanent exit arrangements, including ACCUs released under exit arrangements and outstanding contract volumes.
- The Department of Climate Change, Energy, the Environment and Water released its Safeguard Mechanism review consultation paper on 7 August 2026 with consultation to close on 18 September 2026. The review will assess current policy settings to confirm whether the 2023 reforms are working as intended and will have a primary focus on post-2030 policy settings including the 2030–35 baseline decline rate.
- Across our schemes, progress has exceeded the expectations of many industry participants, but there is further work to be done and challenges remain. These include building momentum for low carbon industrial processes through the Guarantee of Origin, and continuing development of new ACCU methods.
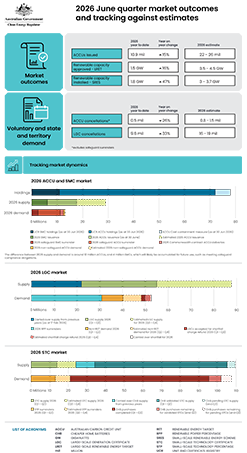
Click on the image below to download a full-sized version.
Ways to read the report
Data workbook
The QCMR data workbook – June quarter 2026 contains the data underlying the figures in the report and additional data, including longer time series data.
Updated: 9 September 2026
Changes
- Figure 1.4 - Australian carbon credit unit (ACCU) holdings (in millions) by market participation
- Figure 1.6 - Australian carbon credit unit (ACCU) non-safeguard cancellations
- Figure 1.7 - Generic Australian carbon credit unit (ACCU) and Safeguard Mechanism credit unit (SMC) volume weighted average spot price
- Figure 2.2 - Large-scale generation certificate (LGC) reported spot and forward prices
- Figure 3.1 - Small-scale cumulative validated battery capacity installed by state and territory in megawatt-hours (MWh) by installation date
- Figure 3.8 - Weekly small-scale technology certificate (STC) supply and the required supply to meet the small-scale technology percentage (STP)
- Figure 3.9 - Small-scale technology certificate (STC) market transactions
- Figure 3.10 - Small-scale technology certificate (STC) reported spot and clearing house prices
New:
- Figure 1.2 - Representation of soil sequestration cap on 3 illustrative projects with sampling every 5 years
- Figure 2.4 - Mid-scale renewable energy approvals in megawatts (MW)
- Figure 2.5 - Utility scale renewable energy approvals in megawatts (MW)
- Figure 2.7 - Quarterly large-scale storage completions in megawatt-hours (MWh)
- Figure 3.2 - Distribution of battery installations approved under the Cheaper Home Batteries Program by small-scale technology certificate (STC) factor bands
- Figure 3.6 - Concurrent small-scale solar installs as % of total installations under the Cheaper Home Batteries Program
Media release
Read the media release: Record solar and battery growth shows clean energy transition accelerating