
Consumer energy resources
On this page
- Battery installations reach record levels in Q2
- Q2 2026 sets new record for small-scale solar capacity
- Mid-scale solar support for Australian businesses and communities
- Market dynamics
- Air source heat pump installations rise
Battery installations reach record levels in Q2
Home battery data shows the first year of the Cheaper Home Batteries Program concluded with a record quarter for installations. Throughout Q2 2026, 111,000 battery installations, representing 3.6 GWh of capacity, were approved under the program.
This exceeded the 83,000 installations and 2.5 GWh of capacity approved by the end of Q1 2026. Due to the time required for applications to be assessed and approved, the number of Q1 2026 installations approved has subsequently increased to 122,000.
Description
This figure shows the cumulative installed capacity of validated small-scale battery installations per state by installation date following the commencement of the Cheaper Home Batteries Program on 1 July 2025.
Small print
A 12 month creation period for registered persons to create small-scale technology certificates applies under the Renewable Energy (Electricity) Regulations (2001). Data is subject to change due to the 12 month creation rule. Totals may not sum due to rounding.
A quarter of 2 parts for home batteries
The quarter had 2 distinct phases: installations completed before 1 May and those completed after the changes to the Cheaper Home Batteries Program took effect. From 1 May 2026, revised STC rates were introduced to provide a more consistent level of support across battery sizes, equivalent to around a 30% reduction in installation costs.
Despite these changes, demand for battery storage remained strong following the introduction of the revised STC settings. Installation activity moderated from the exceptional levels observed in April, while the distribution of battery sizes shifted towards smaller systems. These trends are consistent with consumers and installers bringing forward some battery purchases ahead of the revised STC settings, while underlying demand for battery storage remained strong.
The rest of this section analyses the impacts on installation activity including volumes, battery sizes, and the share of installations coupled with or retrofitted with small-scale solar. Across these metrics, our data shows a consistent pattern of expected behavioural responses to the 1 May changes, followed by ongoing strength in demand for home batteries.
Installed volumes and capacity
The lead-up to the 1 May changes was characterised by exceptionally strong installation activity, with the record Q2 outcome primarily driven by the surge in installation activity in April. By the end of Q2, 78,000 April installations representing 2.8 GWh of capacity had been approved under the Cheaper Home Batteries Program. By comparison, the first 9 months of the program saw an average 40,000 monthly installations representing 980 megawatt-hours of capacity.
Following the 1 May changes, installation rates fell back towards levels seen ahead of the pre-May surge, and the average battery system size decreased markedly, from 36 kWh in April to 23 kWh in May and June. Our analysis of installation data suggests industry participants accelerated activity ahead of the announced 1 May policy changes.
- Installation volumes remained elevated throughout April, with some installers continuing work through weekends and public holidays. Average installation rates on April public holidays and weekends were higher than those observed across the remainder of the program, reflecting efforts to complete installations before the revised STC settings took effect on 1 May.
- The increase in installation activity was concentrated in larger battery systems. The average installed battery capacity in April was above levels observed earlier in the program. This is consistent with industry intelligence indicating that installers prioritised customers wanting larger battery system installations ahead of the changes, as these systems experienced the largest reduction in support under the revised STC settings.
Description
This figure compares the distribution of validated small-scale battery installations across usable capacity ranges, before and after the May 1 changes to the Cheaper Home Batteries Program on 1 May 2026. Pre-May 1 data is from 1 July 2025 to 30 April 2026. Post-May 1 data is from 1 May 2026 to 30 June 2026.
The battery capacity ranges are aligned with the tapering of STCs for larger batteries under the changes to the Cheaper Home Batteries Program, which came into effect on 1 May 2026. For more information, please visit Cheaper Home Batteries Program.
Small print
A 12 month creation period for registered persons to create small-scale technology certificates applies under the Renewable Energy (Electricity) Regulations (2001). Data is subject to change due to the 12 month creation rule. Totals may not sum to 100% due to rounding.
Systems with capacities on the border between ranges are included in the lower range. For example, a 14 kWh system would be included in the 0-14 kWh range.
Retrofits versus new or upgraded small-scale solar
From the commencement of the Cheaper Home Batteries Program to March 2026, batteries installed with upgraded small-scale solar systems accounted for an average of 22.0% of installations. During the April 2026 surge, this proportion fell to 15.6%.
- This is consistent with installers and consumers seeking to complete battery installations before the 1 May changes took effect. For households that already had small-scale solar and were therefore eligible for the Cheaper Home Batteries Program, installers may have prioritised the battery installation ahead of the 1 May deadline, with any associated solar upgrades completed later.
The proportion of batteries installed on existing small-scale solar systems increased to 55% in April before falling to around 42% across May and June. Together, these trends suggest that many battery retrofits were brought forward ahead of the 1 May changes, while installations involving solar upgrades became more common after the changes took effect.
Description
This figure shows the distribution of validated small-scale battery installations by installation type by month of installation, following the commencement of the Cheaper Home Batteries Program on 1 July 2025.
Small print
A 12 month creation period for registered persons to create small-scale technology certificates applies under the Renewable Energy (Electricity) Regulations (2001). Data is subject to change due to the 12 month creation rule.
Under the Cheaper Home Batteries Program, batteries must be connected to a valid solar PV system to be eligible for STCs. Consequently, the submission of applications for batteries concurrently installed with new solar PV are delayed until the associated solar PV system has been validated under the SRES. The most recent month's data may see elevated percentages of retrofitted systems as applications for batteries concurrently installed with solar PV systems may not have been received or validated before the end of the quarter. This elevated retrofit rate will likely be revised down over time as applications for concurrently installed batteries are submitted and validated.
Category definitions
Retrofit installation
Battery installations that were installed more than 90 days after the associated solar PV installation.
Concurrent installation with new solar PV
Battery installations that were installed within 90 days of the associated solar PV installation. The solar PV installation was a new installation for the address.
Concurrent installation with upgraded solar PV
Battery installations that were installed within 90 days of the associated solar PV installation. The solar PV installation was a replacement, extension, or addition for an existing solar PV system at the address.
Replacement small-scale solar rates remain high
The changes to the Cheaper Home Batteries Program influenced more than battery installation volumes and system sizes. The strong demand to install batteries before 1 May also appears to have affected household decisions about small-scale solar, contributing to unusually strong solar installation activity during April. Replacement rates varied across jurisdictions, suggesting local factors may also influence household and business decisions.
Despite the exceptionally strong installation activity observed during April, replacement rates remained broadly consistent with recent trends. For the second quarter in a row, replacements accounted for around 25% of all small-scale solar installations nationally, suggesting that the record Q2 result was primarily driven by growth in new and upgraded systems rather than increased replacement activity.
Description
This figure shows small-scale solar replacements as a proportion of total installations by state and territory over time.
Small print
Replacements represent small-scale solar systems categorised in the Renewable Energy Certificate (REC) Registry as replacements. The installation type data field was added to the REC Registry in late 2020, and was made mandatory from 28 January 2021. Data has not been lag-adjusted. Data is subject to change due to the 12 month creation rule.
Q2 2026 sets new record for small-scale solar capacity
Installed small-scale solar capacity reached a new record in Q2 2026 with more than 1 GW of installations. While some of this strength reflects unusually high installation activity in April, the result nevertheless demonstrates the continuing strength of demand for small-scale solar systems, and points to a possible record year for small-scale solar capacity.
Description
This figure shows the installed capacity in megawatts (MW) and the number of small-scale solar installations over time.
Small print
Small-scale solar systems must have a capacity of less than 100 kilowatts (kW). A 12 month creation period for registered persons to create small-scale technology certificates applies under the Renewable Energy (Electricity) Regulations (2001). Data for installations and installed capacity in the past 12 months have been lag-adjusted to account for the 12 month creation rule and are estimates only. Data is subject to change and totals may not sum due to rounding. Non-lag adjusted figures are available on Small-scale installation postcode data.
While small-scale solar was not directly affected by the 1 May changes to battery incentives, the behavioural response associated with those changes is evident in solar installation data.
- An estimated 480 MW of small-scale solar capacity was installed in April alone, making it the strongest month on record. This contrasts with historical seasonal patterns, where April has typically been one of the weaker months for installed capacity.
- More than 80% of all small-scale solar installations in April were installed concurrently with a home battery, compared with less than 50% in May and June. This suggests that many households bringing forward battery purchases were also bringing forward associated small-scale solar installations. This may be particularly relevant for households that did not originally have small-scale solar installed, as this is a prerequisite for eligibility in the Cheaper Home Batteries Program.
Description
This figure shows the percentage of small-scale solar installed concurrently with a battery by the system's installation month since the start of the Cheaper Home Batteries Program on 1 July 2026.
Small print
A 12 month creation period for registered persons to create small-scale technology certificates applies under the Renewable Energy (Electricity) Regulations (2001). Data is subject to change due to the 12 month creation rule.
Based on current installation activity, 2026 is on track to be a record year for installed small-scale solar capacity. Capacity is currently tracking in line with the projected 3.0 to 3.7 GW range.
While installation activity moderated following the April surge, preliminary lag-adjusted data suggests underlying demand for small-scale solar remained strong. We can compare results with those from 2024, as this year was a near-record year for small-scale solar capacity and was not affected by the commencement of the Cheaper Home Batteries Program. Installations in May 2026 were lower than in May 2024, but June 2026 installations were higher than June 2024. Together, these outcomes suggest that although some activity may have been brought forward into April, demand for small-scale solar remained resilient following the 1 May changes. The moderation in May may also reflect a return to more typical installation patterns following the pre‑1 May surge, including fewer weekend and public holiday installations.
The growing scale of small-scale solar is having an increasingly visible impact on electricity system outcomes. The Australian Energy Market Operator’s Q2 2026 Quarterly Energy Dynamics report found that total electricity demand supplied by consumer energy and the grid – known as ‘underlying’ demand – reached a new Q2 high in the NEM. Despite this increase, electricity supplied through the grid – known as ‘operational’ demand – was lower than a year earlier and at its lowest Q2 average since 2020. This occurred because growth in distributed solar output more than offset the increase in total demand, reducing the amount of electricity required from the grid.
The average small-scale solar system size in Q2 2026 was 10.5 kW, marking a full year in which the quarterly average system size has been greater than 10 kW. This continues the longer-term trend towards larger systems. Installations sized between 15 and 40 kW accounted for 26% of all installations in Q2 2026, up from 16% in Q2 2025, and were the primary driver of growth in average system size. The expansion of SRES eligibility to systems up to 1 MW, discussed next, may provide a further driver of growth in average system sizes.
Description
This figure shows the proportion of solar systems installed under the Small-scale Renewable Energy Scheme (SRES) by capacity band and the average size of rooftop solar systems installed under the SRES over time.
Small print
A 12 month creation period for registered persons to create small-scale technology certificates applies under the Renewable Energy (Electricity) Regulations (2001). Capacity band data has not been lag-adjusted. Average system size data has been lag-adjusted. Data is subject to change. Totals may not sum to 100% due to rounding.
Mid-scale solar support for Australian businesses and communities
On 5 August, the Australian Government announced that solar systems of up to 1 MW will become eligible under the SRES from 1 October 2026, subject to the necessary regulations being in place. The change extends support beyond traditional residential systems and is intended to encourage greater deployment of solar in the commercial, industrial, and agricultural sectors. Eligibility for SRES support will be expanded to provide support for mid-scale solar systems above 100 kW and no more than 1 MW that meet criteria to be specified in the regulations. Eligible mid-scale solar systems installed from 1 October 2026 will be able to create STCs based on a 5-year deeming period each year to 2030, rather than the declining deeming period. More information about eligibility and compliance requirements is available on the department’s website.
While some projects already in development may become eligible shortly after commencement, many industry participants will require time to respond to the new incentives and develop additional projects. As a result, the full effect of the change is likely to emerge over time. Previous CER analysis indicates that systems of this size take at least 8 months from design to approval. The Australian Government has requested that the Australian Energy Market Commission consider rule changes to improve commercial and industrial solar connection processes, which could reduce project delivery times if implemented. The change will also result in additional STC creations. These certificates will be included under the small-scale technology percentage (STP), with the impact on future STP settings expected to be modest.
Market dynamics
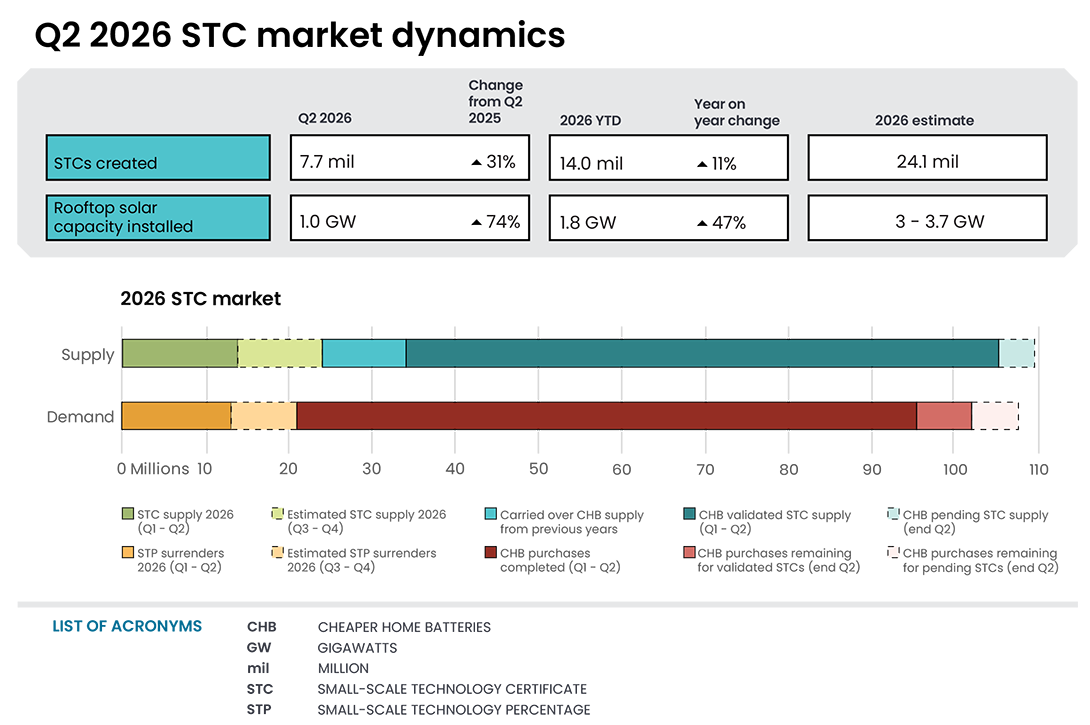
In Q2 2026, 7.7 million STCs were created, excluding STCs created as part of the Cheaper Home Batteries Program. On average, 591,000 STCs were created per week during Q2 2026, which exceeds the average 462,000 requirement to meet the compliance demand of 21.5 million set for the 2026 STP.
Description
This figure shows the weekly supply of STCs in 2026. It also shows the required weekly supply of STCs (462,192) to meet the 2026 STP.
Small print
Required STC supply refers to the estimated number of STCs to be created (24.1 million) to meet the annual STP liability in 2026. Some weeks are spread across multiple months; the month label refers to the month as of the end of the week. STC creations in weeks at the start and end of the shown period may be significantly lower than in other weeks in the year due to them being shorter as a result of the start and end of the quarter.
Figure only includes STCs from the installation of small-scale solar, solar water heater, and air source heat pump systems. STCs from batteries are not included as they are being purchased by the Government and are not available to liable entities to meet their liabilities under the SRES.
A total of 5.4 million STCs were surrendered to meet the 28 July Q2 deadline. During the period between the 29 April and 28 July surrender deadlines, around 1.5 million STCs were purchased from the clearing house by liable entities, indicating that most surrender obligations were met using certificates sourced outside the clearing house.
The surge in battery and small-scale solar installations ahead of the 1 May changes to the Cheaper Home Batteries Program was reflected in STC market activity during Q2 2026. As STC creation volumes increased throughout April, sell offers to the clearing house reached record levels. During this period, the Australian Government continued purchasing STCs through the clearing house under the Cheaper Home Batteries Program. As a result of the higher volume of sell offers, the clearing house surplus peaked at 14.4 million STCs in May, with average wait times increasing to more than 4 weeks.
These market conditions appear to have influenced participant behaviour. Some market participants elected to sell STCs through the open market rather than wait for execution through the clearing house. As a result, 45.5 million STCs were transferred between market participants during Q2 2026, the highest quarterly transaction volume on record.
Following the 1 May changes to the Cheaper Home Batteries Program, STC creation volumes moderated as installation activity returned to more regular levels after the exceptional activity recorded in April. This was accompanied by a reduction in the clearing house surplus from its May peak to 2.5 million STCs by the end of the quarter, while average clearing house wait times declined to 13 days.
Description
This figure shows the volume of STCs transacted and the number of transactions, excluding STC clearing house transactions, over time. Data includes STCs created under the Cheaper Home Batteries Program.
Despite these changes in trading behaviour, STC prices remained close to the clearing house price of $40 throughout the quarter. This indicates that prices for STCs remained resilient despite the unusually high volume of certificates entering the market. Market intelligence suggests that intermediary buying continued to absorb increased certificate supply, limiting downward pressure on spot prices.
Small-scale technology certificate (STC) reported spot and clearing house prices
Note: This figure is not interactive.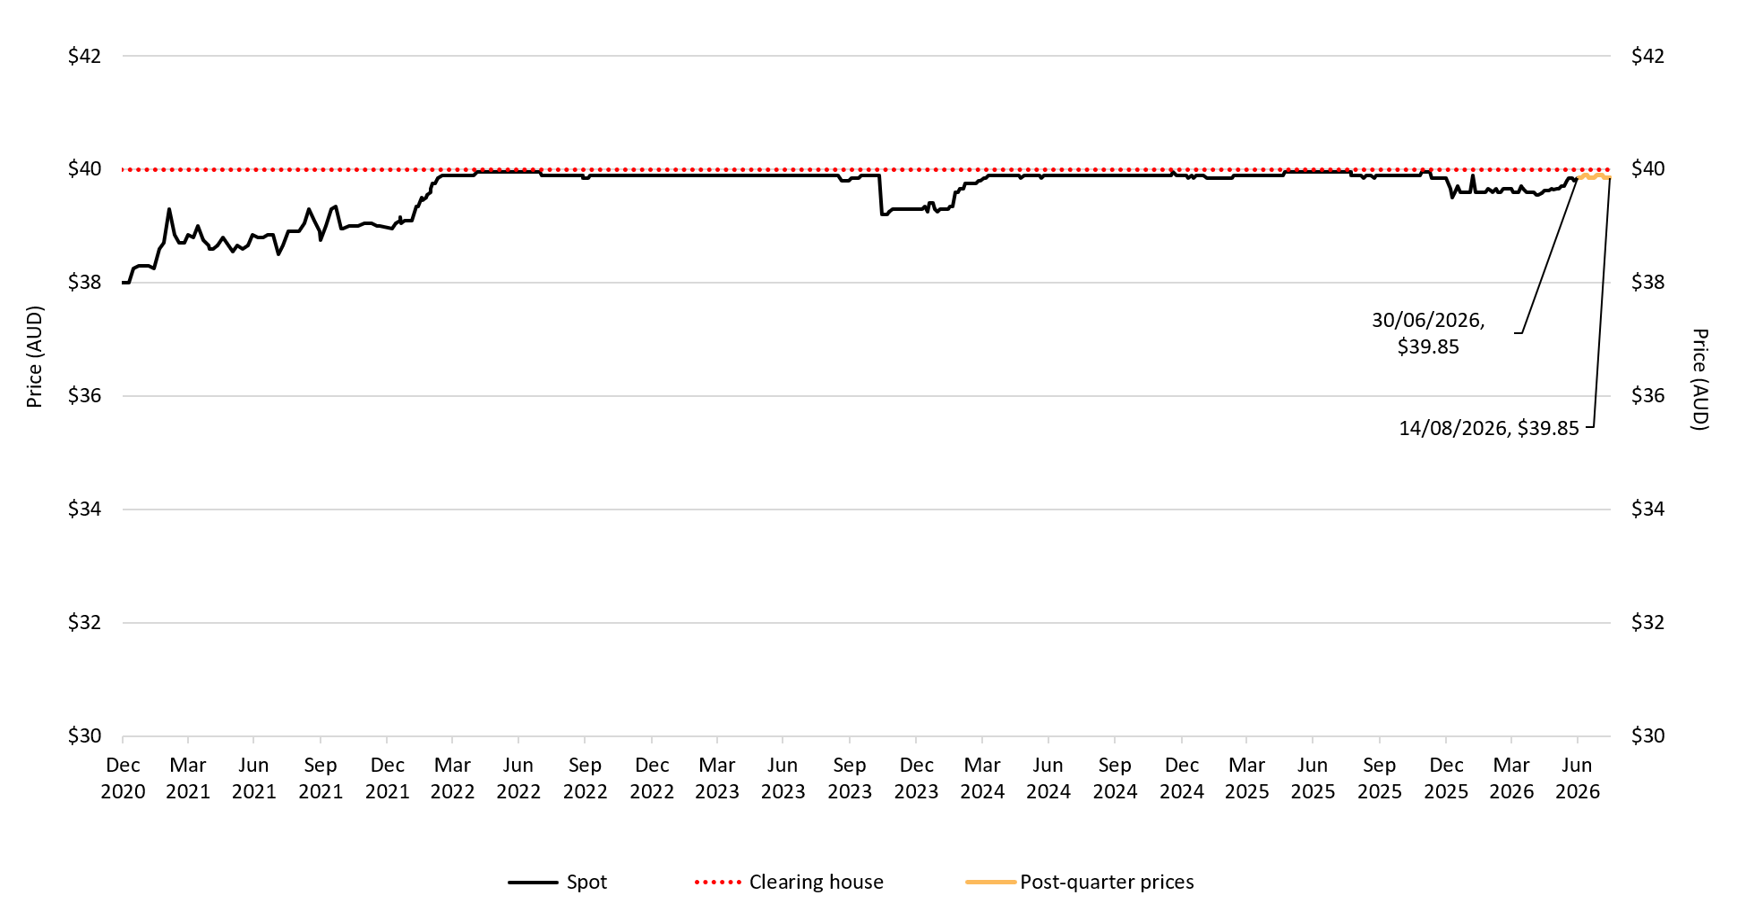
Description
This figure shows the daily closing STC spot price over time. It also shows the STC clearing house price.
Small print
Pricing data is complied from trades reported by CORE markets and may not be comprehensive. Prices are shown from 31 December 2020 to 14 August 2026. The last spot price recorded for the quarter and the last spot price recorded in the dataset are labelled.
Read more about buying and selling STCs, including through the clearing house.
In late June 2026, the REC Registry experienced an incident that temporarily affected system availability between 30 June and 7 July. Although participants were unable to submit applications or complete certificate transactions during the outage, the incident did not affect Q2 2026 STC surrender obligations. We have directly contacted account holders whose accounts have been impacted by duplicate certificates created during the incident.
Air source heat pump installations rise
In Q2 2026, around 28,000 ASHPs were installed, up 16% from Q2 2025. ASHP installations to date in 2026 now number around 49,000.
In Q2, the biggest proportionate year-on-year increase in ASHPs was in WA, which saw 54% more installations in Q2 2026 compared to Q2 2025. Queensland and NSW also saw strong year-on-year growth with 41% and 34% more installations in Q2 2026 compared to Q2 2025 respectively. Tasmania, however, experienced a sharp year-on-year decline, with 48% fewer installations in Q2 compared to a year ago. Victoria remains the largest market for ASHP installations in the country, a position it has held since Q3 2024. Victoria accounted for 50% of all installations in the quarter. This is attributable to the combination of Victoria’s Solar Homes rebate and Victorian Energy Upgrades discount, which represents some of the most generous rebates for ASHP installations in the country.
Description
This figure shows the number of ASHP installations under the Small-scale Renewable Energy Scheme by state and territory over time. It also shows the number of STCs validated from these installations over time. Totals may not sum due to rounding applied to NT.
Small print
Where cell values are less than 10, data have been modified due to privacy considerations. In the figure these values appear as 10.
A 12 month creation period for registered persons to create small-scale technology certificates applies under the Renewable Energy (Electricity) Regulations (2001). Data for installations in the past 12 months have been lag-adjusted to account for the 12 month creation rule and are estimates only. Data is subject to change and totals may not sum due to rounding. Non-lag adjusted figures are available on Small-scale installation postcode data.
There are no STC validations in 2010 as this was before the start of the Small-scale Renewable Energy Scheme.