
Large-scale renewable electricity
Insights
- Generation from large-scale renewables is strong and continues to set records.
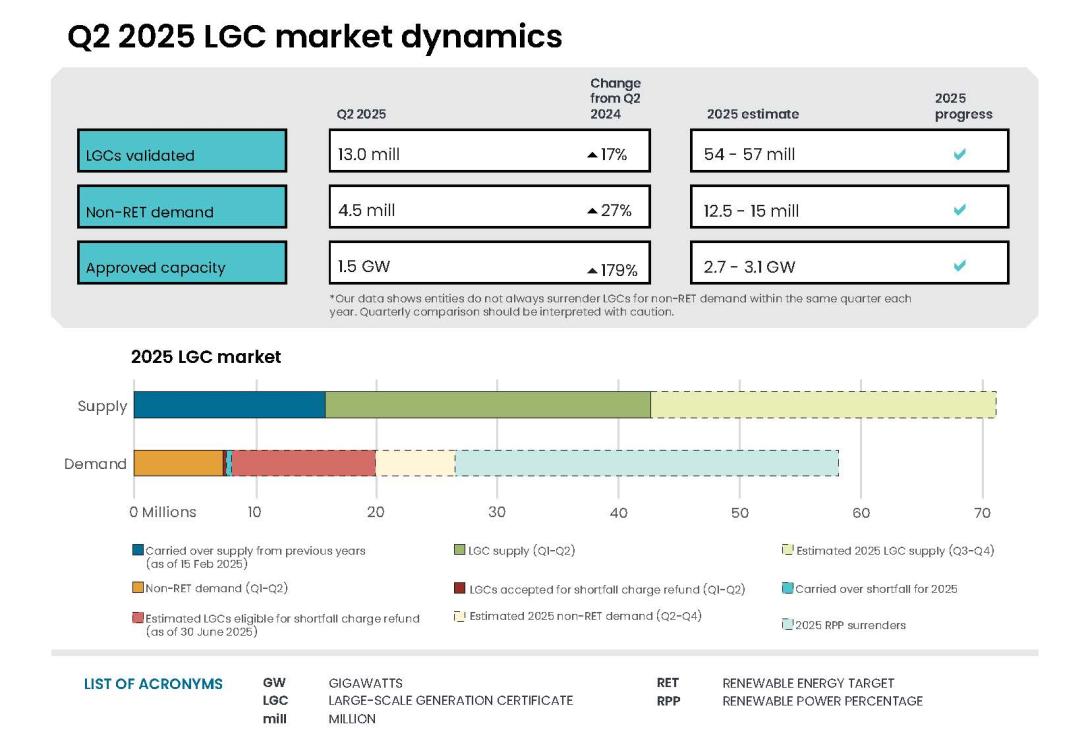
- A Q2 record of 13.0 million Large-scale Generation Certificates (LGCs) were created in Q2 2025, up 17% from Q2 2024. The year-to-date total reached 27.2 million, tracking toward the upper end of the CER’s projection of 54–57 million.
- Total large and small-scale renewables share of generation across the NEM averaged 37.2% in the quarter, up from 31.9% in Q2 2024 and a Q2 record.
- This increase has been driven by new renewable power stations, as well as better generation conditions for wind power, which saw a 31% year-on-year increase compared to Q2 2024, from 5.8 TWh to 7.6 TWh.
- Hydroelectricity (3.5 TWh to 3.7 TWh, 4%) and utility-scale solar (3.1 TWh to 3.6 TWh, 17%) also saw year-on-year increases compared to Q2 2024.
- Renewables penetration in the first half of 2025 reached 40% in the NEM, up from 35% in the first half of 2024.
- Discharge from utility-scale batteries increased to a new all-time quarterly average in the NEM, reaching 0.6% of electricity supplied to the grid in the quarter, up from 0.3% in Q2 2024.
- Capacity being added to the grid remains strong with 2.6 GW of large-scale renewable capacity approved for LGC creation by 22 August 2025. The CER has revised its 2025 projection for large-scale approvals up from 2.7–3.1 GW to 3.0–3.5 GW.
- Renewables investment is being supported by the CIS to develop projects ready for operation by 2030.
- Draft recommendations on the wholesale market settings for next decade from the independent NEM review were consulted on, with submissions closed on 17 September.
- In July, the Australian Government announced the CIS will support 40 GW of capacity, up from 32 GW. This increase has been facilitated by the competitiveness of tenders to date, and reduced costs of installing new solar and batteries.
- In Q2 2025, 6 projects reached FID, totalling 672 MW of capacity and bringing cumulative 2025 FID capacity to 952 MW. As frequently noted, FIDs for individual projects are separate commercial matters and hence variable over time. We will continue to provide updates each QCMR.
- The outlook for voluntary demand for LGCs remains strong.
- 4.5 million LGCs were surrendered in Q2 2025, bringing the year-to-date total to 7.2 million—24% higher than the same time in 2024.
- LGC prices have continued to decline over the quarter. Both supply and demand for LGCs are expected to continue growing over the remaining duration of the Renewable Energy Target (RET), with LGC prices adjusting to balance supply (including inventories) and demand (including shortfall charge redemption).
On this page
- Market dynamics
- Strong approvals in Q2 2025 and 2025 projection revised up
- Modest year to date for FID after a strong 2024
- Capacity Investment Scheme update
- NEM wholesale market setting review draft report released
- Strong non-RET demand to date in 2025
- Renewable Electricity Guarantee of Origin scheme register
Market dynamics
| LGCs (millions) | ||
|---|---|---|
| Supply | Demand | |
| Supply carried over from previous years (as of 15 Feb 2025) | 15.9 | - |
| LGC supply (Q1-Q2 2025) | +27.2 | - |
| Estimated 2025 LGC supply (Q3-Q4 2025) | +26.8 to +29.8 | - |
| Non-RET demand (Q1-Q2 2025) | - | -7.2 |
| Estimated 2025 non-RET demand (Q3-Q4 2025) | - | -5.3 to -7.8 |
| 2025 RPP surrenders (before any shortfall) | - | -32.0 |
| LGCs accepted for shortfall charge refund (Q1-Q2 2025) | - | -0.3 |
| Estimated shortfall charge refund (Q3-Q4 2025) | - | -4.1 |
| Carried over shortfall for 2025 (less than 10% of liability) | - | -0.4 |
| Estimated balance as of 15 Feb 2026^ | 20.5 to 21.0 | |
Notes:
- There is a total of 12.0 million LGCs in shortfall that are eligible for shortfall refunds to be claimed, representing $779.5 million in consolidated revenue. This excludes LGCs in shortfall from entities under administration.
- Estimated 2025 LGC supply, and non-RET demand (Q3-Q4) based on the range of CER estimates for 2025 LGC creations (54 to 57 million) and non-RET surrenders (12.5 million to 15 million) after subtracting Q1-Q2 2025 figures.
- ^Sum of all supply items, less the sum of all demand items. This assumes no further shortfall is taken for the 2025 compliance year.
LGC creations are a function of eligible renewable generation capacity and how much of that capacity is used to produce electricity, which in turn is a function of weather conditions and economics.
A record total of 13.0 million LGCs were created during the quarter, bringing the year-to-date total to 27.2 million. This is a significant increase on the 24.9 million created through the same period in 2024. Total LGC creations are on track to reach closer to the upper end of the CER’s projected 54 to 57 million for 2025.
Most renewable technologies saw growth in LGC creations in the first half of 2025 compared to the first half of 2024 which was affected by both a wind drought and below-average Tasmanian rainfall. Wind, solar and biomass increased creations year-on-year by 9%, 16% and 37%, respectively.
In addition to favourable weather conditions, the growth in LGC creations is attributed in part to the commissioning of utility scale power stations that were accredited under the Large-scale Renewable Energy Target (LRET) over the last 12 months. Several of these power stations are still being commissioned and may generate a higher rate of LGCs in the future. An additional 1.1 million LGCs have been created in aggregate by such power stations in Q2 2025, including:
MacIntyre Wind Farm (923 MW, Qld)
Golden Plains Wind Farm East (756 MW, Vic)
Stubbo Solar Farm (520 MW, NSW)
Walla Walla Solar Farm 1 and 2 (353 MW, NSW)
Goyder South Wind Farm 1B (196 MW, SA)
Cunderdin Hybrid PV Solar and BESS (128 MW, WA).
Large-scale renewable generation contributed a Q2 record of 27.7% (14.9 TWh) of all electricity in the NEM. Wind (7.6 TWh), utility-scale solar (3.6 TWh), and hydroelectricity (3.7 TWh) all saw year-on-year increases in output in Q2 2025. In the NEM, utility-scale battery discharge increased to a new quarterly high of 0.6%, driven by significant increase in battery capacity and helping to make more efficient use of variable renewable energy.
Description
This figure shows the number of LGCs validated by technology type over time.
This figure is interactive. Hover over/tap each segment to see the number of LGCs. Hover over/tap along the line to see the annual total. Click/tap on the items in the legend to hide/show data in the figure.
Small print
Waste coal mine gas is no longer eligible to create LGCs as of 2021. Validations in 2021 reflect LGCs that were created prior to 2021.
As highlighted in the Q1 2025 QCMR, supply continues to exceed demand in the LGC market. The RET has been successful in incentivising investment in large-scale renewable energy, with LGC creations outpacing compliance and voluntary demand despite robust growth in the latter. These conditions have driven down both spot and forward prices. A key future development to monitor is how prices will change if voluntary demand increases materially above historical trends due to mandatory climate disclosures and entities reaching voluntary 100% renewable targets.
The LGC spot price reached its peak for Q2 2025 at $22.25 in early April but fell 26% to end the quarter at $16.50, reaching $12.60 on 22 August. All prices may be trending towards the current future price for 2028 vintage LGCs, which reached $10.25 at the end of Q2 2025.
In the last QCMR, we noted that these price declines are unlikely to materially impact investment, because the drivers of investment are changing, with the Capacity Investment Scheme and outcomes following the NEM review (discussed further below) to dominate future investment decisions. We also noted that liable entities tend to lock in prices for the LGCs they require through power purchase agreements, which hedge producers of renewable electricity against negative price movements in the spot market.
One area where lower LGC prices may have more of an effect on decision-making is in commercial and industrial solar PV at sizes above the 100kW threshold for the Small-scale Renewable Energy Scheme (SRES). Commercial and industrial solar investment will also be impacted by the short timeframe before the end of the RET, which further reduces the incentive to install solar. These effects may be offset by increasing electricity prices for some commercial and industrial customers. The government is currently considering the Climate Change Authority’s (CCA) recommendation for measures to incentivise commercial and industrial solar PV. The CCA’s options included raising the threshold for the SRES and extending the SRES timeframe for this market segment.
As discussed in previous QCMRs, the ongoing declines in LGC prices are expected to incentivise further growth in non-RET demand, as lower prices reduce the cost to entities of reaching renewable energy targets. Market intelligence indicates that both buyers and sellers are acting cautiously in the LGC market, both waiting out for further price movements in their favour.
Large-scale generation certificate (LGC) reported spot and forward prices
Note: This figure is not interactive.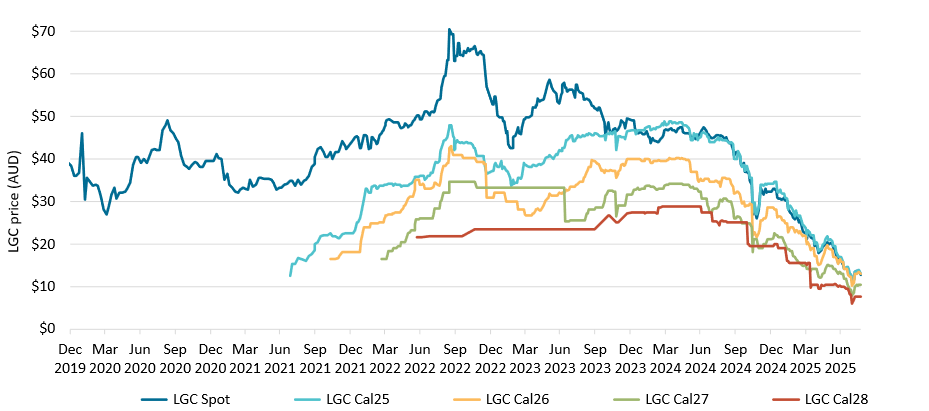
Description
This figure shows the daily closing LGC spot price and calendar year forward prices over time.
Small print
The lines for each "Cal" series shows the forward prices for purchases of LGCs in that calendar year. For example, Cal25 is the 2025 calendar year, where an agreement is made to buy/sell LGCs at a specified price in 2025. Pricing data is compiled from trades reported by CORE markets and may not be comprehensive. Prices are shown from 1 January 2020 to 22 August 2025.
Large-scale generation certificate (LGC) spot price
Note: This figure is not interactive.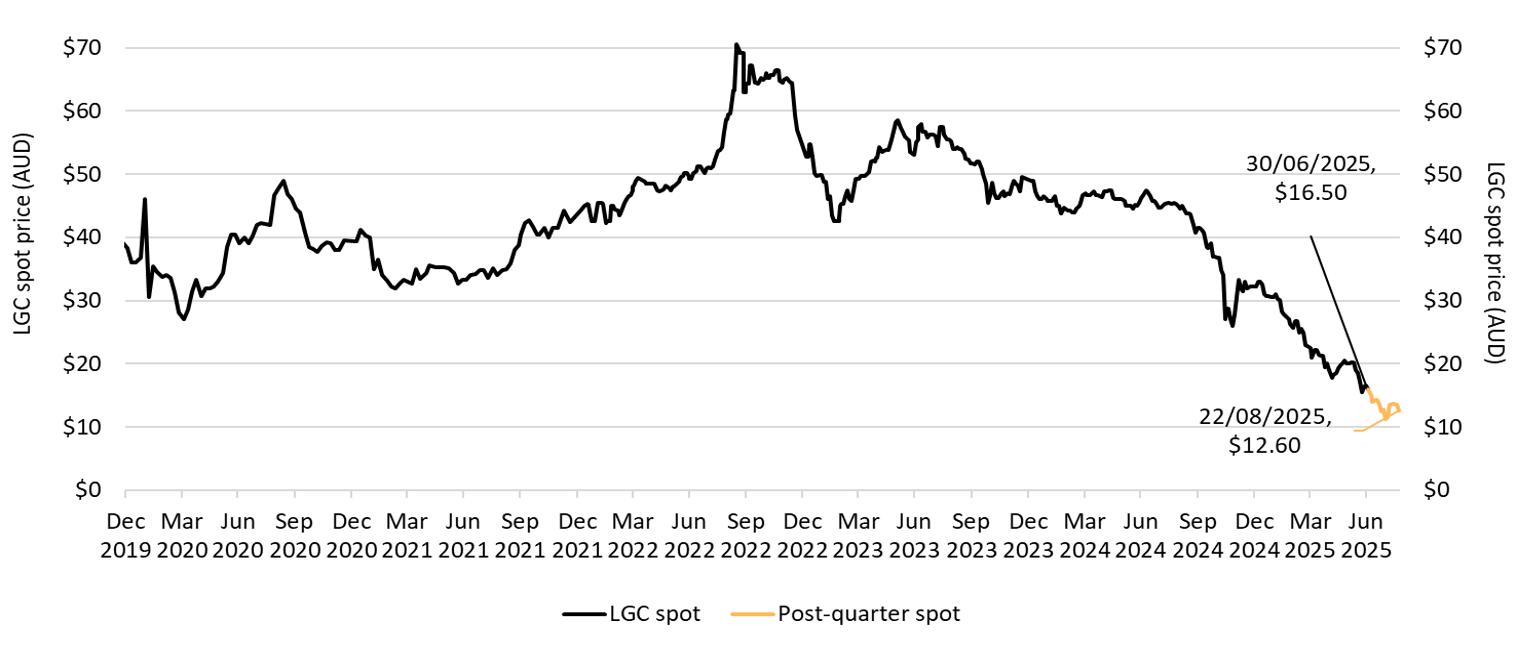
Description
This figure shows the daily closing LGC spot price over time.
Small print
Spot price data is compiled from trades reported by CORE markets and may not be comprehensive. Prices are shown from 31 December 2019 to 22 August 2025.
Strong approvals in Q2 2025 and 2025 projection revised up
In Q2 2025, a total of 1.5 GW of new large-scale solar and wind projects were approved to generate LGCs. This includes 4 major power stations:
- Stubbo Solar Farm (520 MW, NSW)
- Clarke Creek Wind Farm (450 MW, Qld)
- Wollar Solar Farm (346 MW, NSW)
- Mokoan Solar Farm (58 MW, Vic).
Mokoan Solar Farm is the first project successful under Tender 1 of the CIS to be approved under the LRET.
From 1 July 2025 to 22 August 2025, an additional 820 MW of capacity has been approved, including 440 MW from Culcairn Solar Farm, and 46 MW from two biomass projects including Kwinana Waste to Energy Facility (42 MW, WA). These approvals bring total approved capacity to date for 2025 to 2.6 GW.
As of 22 August 2025, 691 MW of large-scale capacity is under assessment by the CER. If all of this is approved within the year—and assuming no further applications that can get approved—the total approved capacity for 2025 could reach 3.3 GW. Given the approvals to date and the current project pipeline, the CER is revising its projection of approved large-scale capacity for 2025 upward to 3.0 to 3.5 GW from the conservative 2.7 to 3.1 GW forecast in the Q4 2024 QCMR.
Description
This figure shows the capacity of large-scale wind and solar power stations approved by the Clean Energy Regulator to generate large-scale generation certificates over time.
This figure is interactive. Hover over/tap each segment to see the capacity. Hover over/tap on each circle to see the annual total. Click/tap on the items in the legend to hide/show data in the figure.
Small print
Solar and wind hybrid projects are grouped under the solar category. Totals may not sum due to rounding.
Modest year to date for FID after a strong 2024
In Q2 2025, 6 projects reached FID, totalling 672 MW of capacity. Notable projects include:
- Wandoan South Solar Farm (240 MW, Qld)
- Cloudbreak Solar Farm (190 MW, WA)
- Lancaster Solar Farm (106 MW, Vic).
This brings the cumulative FID capacity to 952 MW by the end of Q2 2025. This is around 75% of the average we have seen over the first 2 quarters since 2019. It should be noted however that FID is inherently variable over time. For example, FID in 2022 was more than double the FID capacity in 2023 due to a big Q4 2022.
In the Q4 2024 QCMR, we observed that we would expect revenue underwriting agreements available to projects supported through finalised CIS contracts would increase the likelihood of reaching financial milestones such as FID in a reduced timeframe. It was also noted that total capacity reaching FID in 2025 could be around 6 GW or potentially more. Based on progress to date, we now expect this capacity to reach FID over a longer timeframe.
Publicly available information shows 10 of the 19 projects awarded under Tender 1 of the CIS have made progress towards FID, with several receiving development approvals, being granted Renewable Energy Zone (REZ) rights, or starting Environment Protection and Biodiversity Conservation (EPBC) Act assessments during Q2 2025. Of the 6.4 GW of capacity supported under Tender 1 of the CIS, 4.5 GW has advanced in its development since the announcement of successful projects. This includes 1 GW that has had EPBC applications approved, started construction, or been accredited under the LRET. Overall, one of the 19 Tender 1 projects (Goulburn River Solar Farm, 450 MW, NSW) has reached FID and is under construction and one (Mokoan Solar Farm) has been accredited.
Description
This figure shows the total capacity in gigawatts (GW) of large-scale renewable energy projects that were awarded tenders for the CIS. The projects are grouped by development milestones following the announcement of their successful tender application.
This figure is interactive. Hover over/tap each segment to see MW capacity.
Small print
The Clean Energy Regulator tracks public announcements. Data may be incomplete and may change retrospectively.
Description
This figure shows the capacity and four quarter rolling average of large-scale renewable power stations to reach a final investment decision over time.
This figure is interactive. Hover over/tap each bar to see the capacity. Hover over/tap along the line to see the rolling average. Click/tap on the items in the legend to hide/show data in the figure.
Small print
The Clean Energy Regulator tracks public announcements. Data may be incomplete and may change retrospectively. Totals may not sum due to rounding.
Capacity Investment Scheme update
On 29 July, the Australian Government announced a 25% expansion of the CIS to support 40 GW of new renewable energy by 2030. This increase raised targets from:
- 23 GW to 26 GW of renewable generation capacity
- 9 GW to 14 GW of clean dispatchable capacity.
This increase has been facilitated by the competitiveness of tenders to date and reduced costs of installing new solar and batteries.
This followed an 18 June announcement that future CIS tenders will use a single-stage bid process—submitting project and financial details together—cutting the tender timeline from 9 to around 6 months for faster certainty to project proponents and less overlap between tender rounds. Unsuccessful bids may now also be placed on a reserve list for potential Capacity Investment Scheme Agreements if successful projects do not proceed.
Stage B (financial bids) for Tender 3 and Tender 4 closed in Q2 2025, on 1 May and 5 June respectively. Results are expected in September and October respectively:
- Tender 3 targets 16 GWh of dispatchable capacity (equivalent to 4 GW for 4 hours) for the NEM. It received 124 bids totalling 135 GWh in Stage A (project bids).
- Tender 4 aims to secure 6 GW of generation capacity for the NEM. It received 84 bids totalling 25.6 GW in Stage A.
CIS Tenders 5 (Western Australian Wholesale Electricity Market (WEM) generation) and 6 (WEM dispatchable) opened on 29 August 2025. Tender 7 (NEM generation) is expected to open during Q3 2025.
Tender 4 shows growing interest in hybrid solar-storage projects over standalone solar. While both Tenders 1 and 4 had 84 bids, the total generation capacity of Tender 4 bids was 5% lower (from 27 GW to 25.6 GW), but the storage capacity increased by 67% (from 16 GWh to 26.7 GWh). This shift toward storage helps projects better match electricity supply with demand.
NEM wholesale market setting review draft report released
On 6 August 2025, the NEM wholesale market settings review panel released its draft report, with consultation closing on 17 September 2025. The draft report finds that the NEM is facing mounting pressures, becoming more weather dependent, more energy constrained, less scheduled, and less dispatchable. It presents a vision of managing risks in the NEM to ensure it has sufficient investment in critical assets and services, more efficient and stable prices for consumers, reduced reliance on government intervention, and has a more unified transition from the ageing coal-fired power station fleet.
The panel made 9 draft recommendations, themed around supporting the efficient operation of the spot market, and reforms to:
- enhance liquidity in the short-to-medium-term derivatives market
- support new investment in the services the NEM needs
- ensure access for consumers to reliable electricity at fair, simple, and stable prices.
The final report and its recommendations will be considered by energy ministers through the Energy and Climate Change Ministerial Council.
Strong non-RET demand to date in 2025
LGC holdings increased by 9.0 million across the quarter, rising from 26.4 million to 35.4 million. This increase was driven by increases in holdings by liable entities (+4.8 million), power stations (+2.6 million), and non-RET (voluntary) (+2.2 million) accounts. Non-RET (government) entities saw a 1.1 million decrease in holdings due to the ACT Government surrendering certificates for the 2024–25 financial year to meet their 100% renewables target.
In Q2 2025, 4.5 million LGCs were surrendered for non-RET purposes, bringing the year-to-date total to 7.2 million. Compared to the same period in 2024, non-RET surrenders have increased by 1.4 million, or 24%. This growth was driven by existing participants surrendering more LGCs.
The CER expects that non-RET LGC surrenders will total towards the upper end of its 2025 projection of 12.5 to 15 million. There is potential for further upside; Non-RET voluntary surrenders: insights from improved data classification provides insights for potential voluntary demand from new CER analysis.
Description
This figure shows LGC holdings in Renewable Energy Certificate (REC) Registry accounts by market participation category over time.
This figure is interactive. Hover over/tap each data point to see the number of LGCs. Click/tap on the items in the legend to hide/show data in the figure.
Small print
Holdings are for registered LGCs as at the end of the quarter and exclude any pending transactions. Accounts are categorised according to their primary role or function based on transaction patterns and the name of the account. An account's category is subject to change. Totals may not sum due to rounding.
Category definitions
Liable entity
Account holder is a liable entity.
Power station
The account holder has created more LGCs than it has surrendered.
Non-RET (voluntary)
The majority of LGCs surrendered by the account holder have been surrendered voluntarily, or the account is labelled as 'GreenPower' in the REC registry.
Non-RET (compliance)
The majority of LGCs surrendered by the account holder have been surrendered voluntarily for non-RET compliance reasons (for example, desalination plants).
Non-RET (government)
The majority of LGCs surrendered by the account holder have been surrendered voluntarily for a government entity.
Intermediary
Account holder has transacted/received over 100,000 LGCs and does not fit into any of the other categories.
Other
Account holder does not fit into any of the other categories.
In addition to the potential for growth in voluntary demand from existing sources, the number of entities surrendering LGCs for the first time is growing. In Q2 2025, 60 unique entities surrendered LGCs for the first time, a 62% increase compared to 37 first-time surrenders in Q2 2024. Although the volumes surrendered by these new entrants are currently small (with a median surrender of around 159 LGCs), they are expected to increase over time. Historically, entities tend to surrender more LGCs in subsequent years following their initial participation. For example, the median second-year surrender for entities is 67% higher than the amount surrendered in the first year.
Description
This figure shows non-RET LGC cancellations by demand source over time.
This figure is interactive. Hover over/tap each bar to see the number of LGCs cancelled. Click/tap on the items in the legend to hide/show data in the figure.
Small print
This classification system is uniform across Australian carbon credit unit (ACCU) and LGC cancellations.
Covered activities for each classification
Voluntary demand
Cancellations made against voluntary certification programs such as Climate Active and any sort of organisational emissions or energy targets.
Government demand
Cancellations by or on behalf of government entities. For example to offset emissions from vehicle fleets or meet voluntary emissions reduction targets.
Compliance demand
Cancellations made by private organisations and corporations for compliance or obligations against municipal, local, state and territory government laws, approvals, or contracts. For example to meet Environmental Protection Authority requirements.
Non-RET voluntary surrenders: insights from improved data classification
Improvements to the CER’s classification of non-RET surrenders mean more insights into potential non-RET demand for LGCs.
Entities with voluntary renewable energy or other climate commitments are one source of voluntary demand for LGCs. Entities with large emissions from electricity (‘Scope 2 emissions’) without a compliance obligation to manage emissions such as the Safeguard Mechanism may be a future source of increased demand. Table 2 shows the top 100 entities by Scope 2 emissions, aggregated by industry. It shows scope 2 emissions according to National Greenhouse and Energy Reporting (NGER) data, and recent LGC surrender activity.
Based on publicly available information, over 90 of these 100 entities would report in the first tranche of mandatory climate reporting. This would require entities to report on climate-related information such as their metrics and targets in relation to scope 1, 2, and 3 greenhouse gas emissions.
LGC surrenderers tend to be companies in the supermarket, data centre, telecommunications, and transport sectors. Although many of these organisations have already surrendered significant volumes of LGCs, there is still considerable potential for growth. For example, all 5 entities aggregated under the retail trade industry have 100% voluntary renewable electricity commitments, mostly by 2025.
This analysis has been made possible by recent improvements in how the CER classifies non‑RET surrenders. Previously, surrenders were classified based on the account making the surrender, which posed challenges because entities often surrender on behalf of others. This made it difficult to accurately analyse trends and identify the true source of LGC demand.
The CER has implemented a process to identify the actual benefitting entity for each non-RET surrender. This is based on information provided in surrender notes, which are submitted as free text. These changes do not affect the total number of LGCs surrendered for non-RET purposes but do improve the classification of surrenders across voluntary, compliance, and government categories.
The new identification process does not account for surrenders made by entities through programs such as GreenPower, as the CER cannot ascribe these surrenders to specific benefitting entities. Gaps in the data on non-RET surrenders also may not allow for surrenders to be attributed across multiple time periods (e.g. surrenders for multiple quarters or years) unless specified in the surrender notes.
Where applicable, these updates have also been applied to LGC holdings.
| No. of entities | Scope 2 emissions (Mt CO2-e) | Electricity consumption based on market-based residual factors (million MWh/LGCs) | LGC surrenders (millions) | ||
|---|---|---|---|---|---|
| 2024 | Q1-Q2 2025 | ||||
| Mining | 23 | 24.8 | 30.6 | 0.4 | 0.7 |
| Electricity, gas, water, and waste services | 22 | 13.9 | 17.2 | 0.3 | 0.2 |
| Manufacturing | 22 | 9.8 | 12 | <0.1 | <0.1 |
| Retail trade | 5 | 3.3 | 4 | 0.9 | 0.3 |
| Information media and telecommunications | 9 | 3.3 | 4 | 0.2 | 0.5 |
| Transport, postal and warehousing | 8 | 2 | 2.5 | 0.2 | 0.3 |
| Other industries | 11 | 2 | 2.5 | <0.1 | <0.1 |
| Total (top 100) | 100 | 59 | 72.8 | 2 | 2 |
Note: Scope 2 emissions are reported under the National Greenhouse and Energy Reporting (NGER) scheme. To estimate electricity consumption, these emissions are divided by the market-based emissions intensity factor, which is 0.81 kg CO₂-e per kWh for 2024–25. This is for illustrative purposes only and will differ from the actual level of electricity consumption. Only includes surrenders which the CER was able to allocate to the entity based on details provided in the non-RET surrenders data. Numbers have been rounded and may not sum to totals.
Renewable Electricity Guarantee of Origin scheme register
The Renewable Electricity Guarantee of Origin (REGO) scheme is expected to commence in November this year and operate alongside the RET. It will certify renewable electricity from an expanded set of sources relative to the RET. It is intended to provide an ongoing renewable electricity certification mechanism once the RET ends in 2030. REGO certificates will be tradeable like LGCs, but unlike the RET there are no annual scheme targets. Only LGCs can be surrendered for compliance under the RET.
There will be 3 types of systems eligible to register under REGO as renewable electricity facilities: electricity generation systems (systems that generate electricity from an eligible renewable energy source), energy storage systems (systems that can store energy and release electricity), and aggregated systems (multiple generation or storage systems managed as a single facility). Electricity generation and energy storage systems can register from the start of the scheme. More work is planned to include aggregated systems into REGO.
During the period up to the end of 2030 when both schemes are active, facilities already registered under the LRET will have the option to create either LGCs or REGOs for each unit of electricity. This includes below-baseline generators, which will be eligible to produce REGOs for all their generation, although only below-baseline REGOs can be created for electricity generation below the facility’s baseline. Storage facilities will be required to demonstrate that the electricity they have stored is from renewable sources to be eligible to create REGOs from subsequent electricity dispatch. This can be demonstrated through a direct supply relationship with an eligible renewable electricity generation system, or through the retirement of REGOs or surrender of LGCs.
For generators eligible to produce either certificate, it is expected LGCs will be preferred over REGOs unless the buyer of the certificate requires time stamping as LGCs can be used for both RET obligations and voluntary surrenders, while REGOs cannot be surrendered under the LRET.
The GO register will enable users to identify and inspect facility’s characteristics and registration status and the attributes of REGO certificates. It will display additional details compared to the current REC Registry, including:
- Temporal information on electricity generation or dispatch (choice of hour, day, month, or year).
- Identification of REGO certificates from ‘below baseline’ generation from pre-1997 facilities.
- Electricity exported from Australia.
The REGO scheme aims to furnish a comprehensive range of attributes as certificate inclusions. Tables 2.3 and 2.4 provide a comparison of some key attributes in both the current REC Registry and the forthcoming GO register, noting GO register attributes are subject to legislative finalisation. The Department of Climate Change, Energy, the Environment and Water have also consulted on additional optional content relating to First Nations ownership status and other verifiable co-benefits associated with the contribution of First Nations peoples, with policy development ongoing.
| REC Registry | GO register | |
|---|---|---|
| Name/Location/Identifier | Yes | Yes |
| Accreditation date | Yes | Yes |
| Facility type | - |
|
| Status | Yes | - |
| Fuel source | Yes | Yes |
| Baseline | Yes | Yes |
| Network connection | - | Yes |
| Other schemes participation | - | TBC |
| Native title or Indigenous Land Use Agreement | - | TBC |
Note: Items labelled TBC are still subject to finalisation following consultation by DCCEEW.
| REC Registry | GO register | |
|---|---|---|
| Amount of electricity represented | Yes | Yes |
| Timestamp | - | TBC |
| Energy source | Yes | TBC |
| Originating facility accreditation code | Yes | TBC |
| Certificate status | Yes | Yes |
| Certificate type | - |
|
| Certificate serial number | Yes | TBC |
| Serial number sequence | Yes | - |
| Exported electricity | - | TBC |
| Retirement purpose | - | TBC |
| Retirement beneficiary | - | TBC |
Note: Items labelled TBC are still subject to finalisation following consultation by DCCEEW.