
Small-scale Renewable Energy Scheme
Insights
- The Cheaper Home Batteries Program opened for applications on 1 July 2025, with the CER receiving around 55,000 applications by mid-September, representing over one GWh of capacity.
- Of these applications, nearly 41,000 had been validated, representing over 700 MWh of capacity. This is greater than the initial operational capacity of the Waratah Super Battery, Australia's largest in-service battery, at 700MWh.
- Around 45% of solar batteries are installed concurrently with a PV system, with the remainder retrofitted. ('Concurrent' systems include those installed from scheme announcement to launch.)
- On average, households are installing batteries with capacity equivalent to the energy their solar PV generates when it runs at full capacity for 2 hours.
- There was a 12% decline in PV capacity to 1.3 GW in the first half of 2025 compared to the same period in 2024. Market intelligence suggests:
- Some prospective system owners delayed installations, awaiting the Cheaper Home Batteries Program.
- A proportion of battery/PV combination installations that were ready to commission before 1 July, were commissioned and registered subsequently.
- Longer term, we expect to see an increase in PV capacity as households seek to make full use of their newly installed batteries.
- There is expected to be strong demand for new solar PV systems to replace older and smaller systems that have reached the end of their contracted feed-in tariff.
- With lower PV capacity, quarterly STC creations were below expectations. More liable entities therefore turned to the STC Clearing House to meet their quarterly surrender requirements.
On this page
- Strong start to the Cheaper Home Batteries Program
- Cheaper Home Battery Program – results so far
- Early insights from the Cheaper Home Batteries Program
- Improved solar battery data now part of the monthly SRES postcode data
- STC market dynamics
- Solar PV installs dip, but pickup expected
- Air source heat pump installations expected to remain highest in Victoria
- Supplementary figures
Strong start to the Cheaper Home Batteries Program
The Cheaper Home Batteries Program opened on 1 July and is progressing well with strong interest.
- Batteries installed with new or existing solar PV systems are now eligible to create STCs, which will reduce the cost of the typical battery by around 30%. Further details on eligibility and the rate of STCs that may be created per kilowatt-hour of battery capacity are available on the Department of Climate Change, Energy, the Environment and Water's website.
- The obligations of liable entities under the SRES – generally electricity retailers – are not affected by the inclusion of batteries in the scheme. This will ensure the cost of the Cheaper Home Batteries Program will not be passed through to electricity prices.
- The government will regularly purchase STCs equivalent to the volume created through the Cheaper Home Batteries Program for battery installations through the STC Clearing House. These STCs will subsequently be cancelled to remove them from the market.
Cheaper Home Battery Program – results so far
The Cheaper Home Batteries Program saw 40,619 battery installations validated by the CER with a total capacity of 725 MWh through to 14 September 2025, with an additional 14,935 installations representing 314 MWh of capacity under assessment. To put this in context, this is already bigger than the 700 MWh initial operational capacity of Australia's largest in-service battery, the Waratah Super Battery.
As with all other eligible systems under the SRES, there is a 12-month window for registered persons to create STCs. Consequently, this figure will increase over time as more systems that were installed apply for STCs under the scheme.
Description
This figure shows the daily cumulative installed capacity of small-scale battery installations per state following the commencement of the Cheaper Home Batteries Scheme on 1 July 2025.
This figure is interactive. Hover over/tap each section to see installed capacity. Click/tap on the items in the legend to hide/show data in the figure.
Small print
A 12 month creation period for registered persons to create small-scale technology certificates applies under the Renewable Energy (Electricity) Regulations (2001). Data is subject to change due to the 12 month creation rule. Totals may not sum due to rounding.
Description
This figure shows the distribution of validated small-scale battery installations across usable capacity in 5-kilowatt hour (kWh) ranges, following the commencement of the Cheaper Home Batteries Scheme on 1 July 2025.
This figure is interactive. Hover over/tap each bar to see number of installations.
Small print
A 12 month creation period for registered persons to create small-scale technology certificates applies under the Renewable Energy (Electricity) Regulations (2001). Data is subject to change due to the 12 month creation rule.
Early insights from the Cheaper Home Batteries Program
CER analysis of the first 2 complete months of solar batteries data, July and August 2025, show that:
- 54% of validated batteries were sized 10-20 kWh for a total capacity of 237 MWh, with an average validated battery capacity of 15 kWh.
- Around 45% of battery installations are estimated to be 'concurrent' installations. This includes all installations during the period from scheme announcement to launch.
- Of the concurrent battery installations, 47% have been connected to a replacement, addition, or extension solar PV system.
- For comparison, 29% of solar PV installations in Q2 2025 were replacements, additions, or extensions. This suggests that the inclusion of batteries may further grow in the SRES as households and businesses add to their existing systems or replace for a bigger system.
- The remaining 55% of battery installations are estimated to be 'retrofitted' to an existing solar PV.
- 47% of battery installations can be linked to solar PV installed over 12 months ago. This proportion may rise as existing solar PV holders consider a future battery installation.
- Unsurprisingly, households and businesses with bigger solar PV systems tend to install bigger batteries. On average, installed battery capacity is equal to the maximum amount of energy that the solar PV system can generate over 2 hours.
Batteries provide benefits to their owners through lower electricity bills but also have wider benefits by helping us use our existing network and generation assets more efficiently. Some of the NEM review's draft recommendations relate to changes that will be important for realising these benefits. See Solar batteries and the NEM wholesale market review for more information.
Description
This figure shows the distribution of the delay between small-scale battery installations and their associated solar PV installation, following the commencement of the Cheaper Home Batteries Scheme on 1 July 2025. The categories of installations are shown as a percent of the total.
This figure is interactive. Hover over/tap each segment to see each proportion of installations. Click/tap on the items in the legend to hide/show data in the figure.
Small print
A 12 month creation period for registered persons to create small-scale technology certificates applies under the Renewable Energy (Electricity) Regulations (2001). Data is subject to change due to the 12 month creation rule. This data represents the portion of battery installations with an identified solar PV system attached. Around 10% of battery installations cannot automatically be linked to a solar PV installation due to data quality issues. The CER will continue to update this data.
Solar batteries and the NEM wholesale market review
As the NEM wholesale market settings review has noted, one important ingredient for realising the network benefits of batteries is increased visibility of a broader range of resources including solar batteries.
As the draft review notes, effectively orchestrating household battery storage into the NEM wholesale market could significantly benefit consumers. While poor management would mean significant amounts of small-scale storage interacting with the grid could create issues like those caused by rooftop solar, with higher costs of managing system security risks. AEMO would face the challenge of managing a system in which the behaviour of a substantial volume of demand and supply is not operationally visible or predictable.
The Panel's recommendations aim to pre-empt these issues so that the maximum benefit from household batteries can be delivered to all consumers. Submissions on the draft report closed on 17 September with feedback guiding work towards the final recommendations and implementation plans.
Improved solar battery data now part of the monthly SRES postcode data
The Cheaper Home Batteries Program means improved information about solar battery installations, allowing for a more accurate picture of battery uptake.
More reliable information about battery installations will assist distributed network service providers (DNSPs) in network planning, while also providing emergency services a clearer understanding of electrical risks when attending jobs.
The CER will continue to publish additional data and insights in future QCMRs and monthly data updates in the SRES postcode data.
Prior to 1 July 2025, the CER reported monthly battery installations at state, territory, and national levels, however, this data was voluntarily reported to the CER. As a result, these figures were likely to be underestimates of solar battery numbers and capacity. While the pre-1 July data is still available on the CER website as an archived dataset, it has been superseded by data from the Cheaper Home Batteries Program.
The early insights in this report will be updated and expanded as more scheme data becomes available and we implement improvements to historical scheme data.
- All battery installations under the SRES must be connected to a solar PV system. The accreditation code of solar PV systems is reported to the CER where this is known. Where this is not available, the CER has conducted preliminary analysis to match battery installations to solar PV systems installed under the SRES using address data.
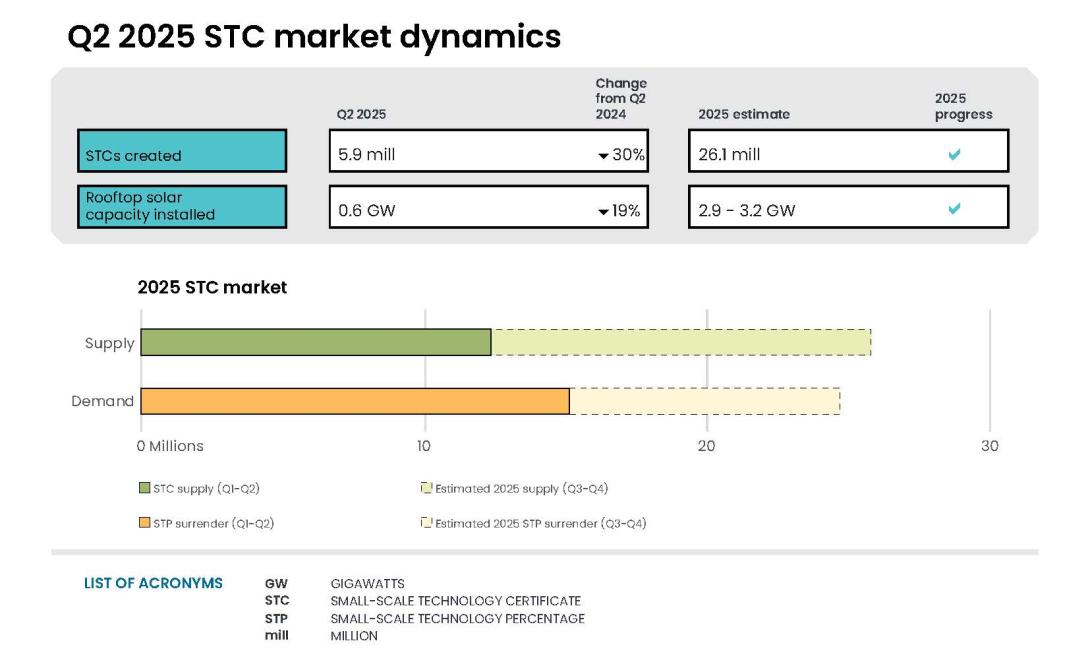
STC market dynamics
Rooftop solar installations in Q2 2025 were lower than the same period in 2024, leading to reduced STC creations (see the 'Solar PV update' below for more details). The average weekly STC creation rate was around 420,000, below the average weekly supply of 500,000 consistent with the 2025 small-scale technology percentage (STP). The relative shortfall meant more liable entities sourced STCs from the STC Clearing House.
With the increased demand, the STC Clearing House remained in deficit throughout Q2, with material use in the lead up to the 28 July Q2 surrender deadline. As a result, the STC market price remained near its market cap of $40 throughout this period. Q2 2025 surrenders were 6.4 million STCs, with 5.8 million being purchased from the Clearing House throughout June and July. This resulted in the Clearing House being 4 million in deficit following the surrender deadline.
Description
This figure shows the weekly supply of STCs in 2025. It also shows the required weekly supply of STCs (501,923) to meet the 2025 STP.
This figure is interactive. Hover over/tap each segment to see the number of STCs. Hover over/tap along the line to see the number of required STCs. Click/tap on the items in the legend to hide/show data in the figure.
Small print
Required STC supply refers to the estimated number of STCs to be created (26.1 million) to meet the annual STP liability and under/over supply from previous years. Some weeks are spread across multiple months, the month label refers to the month as at the end of the week. The final week may be significantly lower than prior weeks if the quarter ends during the week. For example, Q2 2025 ended on Monday 30 June so the final ‘week’ of June contains only one day.
Small-scale technology certificate (STC) reported spot and clearing house prices
Note: This figure is not interactive.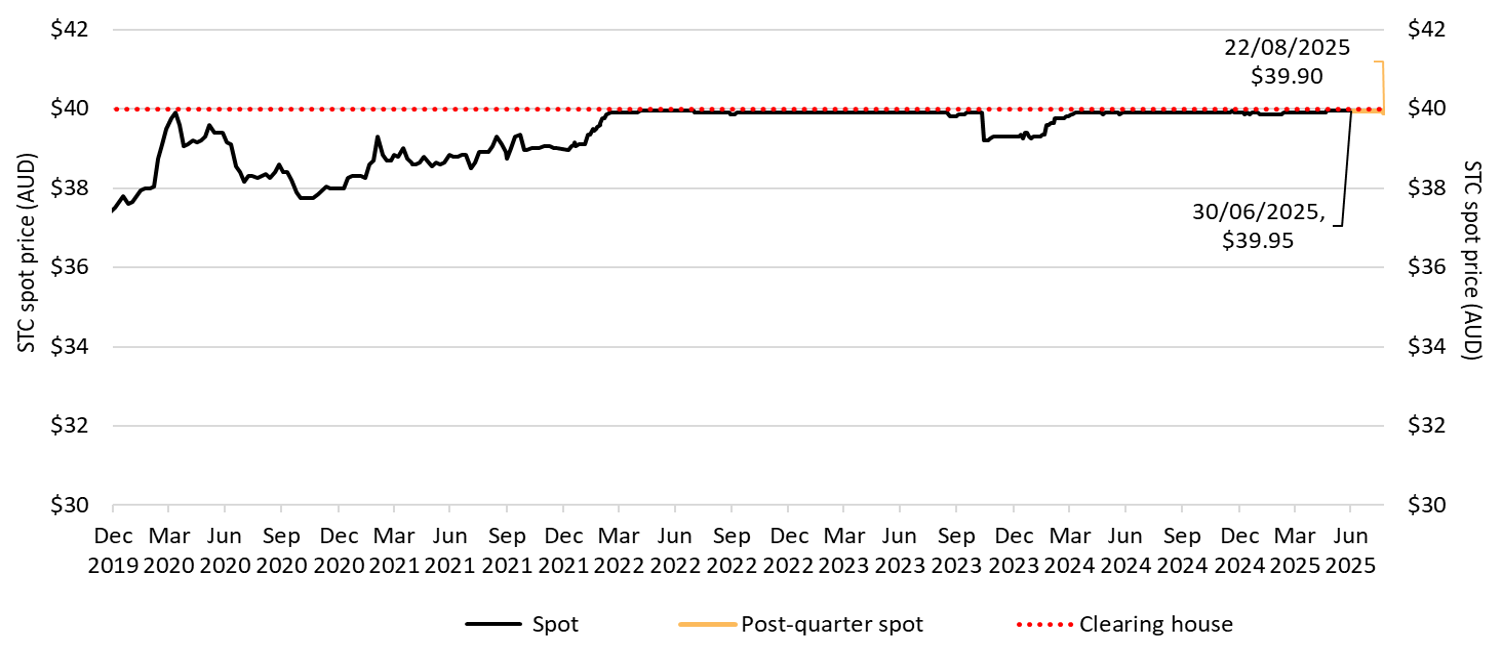
Description
This figure shows the daily closing STC spot price over time. It also shows the STC clearing house price.
Small print
Pricing data is complied from trades reported by CORE markets and may not be comprehensive. Prices are shown from 31 December 2019 to 22 August 2025.
Read more about buying and selling STCs, including through the clearing house.
Solar PV installs dip, but pickup expected
Installed PV capacity in both Q1 and Q2 2025 was lower than the same quarters in 2024. There was a 12% decline in capacity to 1.3 GW in the first half of 2025 compared to the same period in 2024.
Average system sizes increased to 10.1 kW in Q2 2025, up from 9.9 kW in Q1 2025 and 9.6 kW in the same quarter last year.
Market intelligence suggests the decline in installations is related in part to the rollout of the Cheaper Home Batteries Program, and was broadly anticipated:
- Consumers were awaiting the Cheaper Home Batteries Program roll-out before committing to installing a PV system. Industry intelligence indicates that, since the roll-out on 1 July, installers are focusing on battery installations for their recent PV system client base, rather than pursuing new clients for PV systems.
- In some cases, systems were also being physically installed to the point of 'Ready to Commission' in Q2 but not finalised until Q3. The installation of battery and PV systems is not considered finalised until a certificate of electrical compliance or equivalent is issued by the installer. Installers are finalising the installation of these Q2 'Ready to Commission' systems in Q3 and submitting STC creation applications in line with Solar Accreditation Australia's published transitional arrangements. These PV systems will only appear in the Q3 figures.
Description
This figure shows the installed capacity and the number of small-scale rooftop solar installations over time.
This figure is interactive. Hover over/tap each line to see the capacity. Hover over/tap along the line to see the number of installations. Click/tap on the items in the legend to hide/show data in the figure.
Small print
Small-scale rooftop solar systems must have a capacity of less than 100 kilowatts (kW). A 12 month creation period for registered persons to create small-scale technology certificates applies under the Renewable Energy (Electricity) Regulations (2001). Data for installations and installed capacity in 2024 and 2025 have been lag-adjusted to account for the 12 month creation rule and are estimates only. Data is subject to change and totals may not sum due to rounding.
As the backlog of 'Ready to Commission' Q2 installations are finalised and installers pivot back to installations of new PV systems, as well as replacement and upgrades to older systems, PV capacity and installation figures should recover through to the end of the year. As such, the CER has left our estimate of 2.9 to 3.2 GW of installed capacity in 2025 unchanged but note that the uncertainty around the range has increased as the initial impacts of new policy play out.
The share of PV systems that were replacements was a new record of 22% of total installs in the quarter, up from 19% in each of the previous 4 quarters. Around one-third of all Q2 2025 installations in Queensland were replacement systems, up from 27% in Q1.
- Although it is not possible to attribute this increase to a single factor, higher replacement rates in the quarter could be partially driven by the impact of Cyclone Alfred.
- CER data shows that replacement rates in cyclone-affected regions have increased relative to other areas in Queensland. This included regions such as Moreton Bay and Redland. While these regions typically had higher replacement rates even prior to the cyclone, the difference in replacement rates has increased in Q2 2025.
In addition to weather events, other factors are likely to increase replacement rates, including that some smaller, older systems are receiving historically high state-based solar feed-in tariffs which end in the coming years. Replacements installed in 2025 on average are replacing a system 11.6 years old. Given the number of systems installed each year increased until 2021, more systems will reach replacement age later this decade and in the early 2030s, This will likely increase the proportion of installations that are replacements over time, other things equal. It is expected that replacement systems will have significantly higher capacity, consistent with the growth in the average size of systems installed.
Description
This figure shows small-scale rooftop solar replacements as a proportion of total installations by state and territory over time.
This figure is interactive. Hover over/tap each line to see the proportion of installations. Click/tap on the items in the legend to hide/show data in the figure.
Small print
Replacements represent small-scale rooftop solar systems categorised in the Renewable Energy Certificate (REC) Registry as replacements. The installation type data field was added to the REC Registry in late 2020, and was made mandatory from 28 January 2021. Data has not been lag-adjusted. Data is subject to change due to the 12 month creation rule.
Air source heat pump installations expected to remain highest in Victoria
Around 20,000 fewer air source heat pumps (ASHPs) have been installed in the first half of 2025 relative to the same point last year. Around 22,400 ASHPs were installed in Q2 2025, bringing the total number installed to date in 2025 to around 41,000. This is compared to around 61,000 at the same point in 2024.
Following changes in NSW in June 2024 that reduced state government support for ASHPs to a maximum of $900, while Victoria maintained incentives that can reduce installation costs by up to $2500. The higher incentive in Victoria continues to see the highest rates of installation in that state.
Description
This figure shows the number of air source heat pump (ASHP) installations under the Small-scale Renewable Energy Scheme (SRES) by state and territory over time. It also shows the number of STCs validated from these installations over time. Totals may not sum due to rounding applied to NT.
This figure is interactive. Hover over/tap over each section to see the number of installations. Hover over/tap along the line to see number of STCs. Click/tap on the items in the legend to hide/show data in the figure.
Small print
Where cell values are less than 10 data have been modified due to privacy considerations. In the figure these values appear as 10.
A 12 month creation period for registered persons to create small-scale technology certificates (STCs) applies under the Renewable Energy (Electricity) Regulations (2001). Data for installations in 2024 to 2025 have been lag-adjusted to account for the 12 month creation rule and are estimates only. STC validation data has been rounded to the nearest thousand. Data is subject to change.
Supplementary figures
Description
This figure shows the proportion of rooftop solar systems installed under the Small-scale Renewable Energy Scheme (SRES) by capacity band and the average size of rooftop solar systems installed under the SRES over time.
This figure is interactive. Hover over/tap each section to see the proportion of installations. Hover over/tap along the line to see the system size. Click/tap on the items in the legend to hide/show data in the figure.
Small print
A 12 month creation period for registered persons to create small-scale technology certificates applies under the Renewable Energy (Electricity) Regulations (2001). Capacity band data has not been lag-adjusted. Average system size data has been lag-adjusted. Data is subject to change. Totals may not sum to 100% due to rounding.
Description
This figure shows the rooftop solar capacity installed under the Small-scale Renewable Energy Scheme (SRES) by state and territory over time.
This figure is interactive. Hover over/tap each line to see the capacity. Click/tap on the items in the legend to hide/show data in the figure.
Small print
A 12 month creation period for registered persons to create small-scale technology certificates applies under the Renewable Energy (Electricity) Regulations (2001). Data for installations in 2024 to 2025 have been lag-adjusted to account for the 12 month creation rule and are estimates only. There may be small differences between the sum of lag-adjusted state and territory estimates and the national lag-adjusted estimate. Data is also subject to change and totals may not sum due to rounding.
Description
This figure shows STC supply over time.
This figure is interactive. Hover over/tap each bar to see the number of STCs. Hover over/tap along the line to see the annual total number of STCs.
Description
This figure shows the volume of STCs transacted and the number of transactions, excluding STC clearing house transactions, over time.
This figure is interactive. Hover over/tap each bar to see the number of STCs. Hover over/tap along the line to see the number of transactions. Click/tap on the items in the legend to hide/show data in the figure.