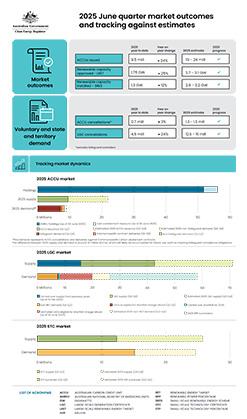
The QCMR report consolidates information across the national carbon markets that the CER administers for the June Quarter 2025 (April to June 2025). It provides information on supply and demand trends and opportunities that may inform market decisions.
On this page
Highlights
- Renewables in the National Electricity Market (NEM) hit a quarterly record 37% of generation in Q2, thanks to new power stations and better wind conditions. Renewable electricity production increased by 18% compared to Q2 2024, from 17 terawatt-hours (TWh) to 20 TWh.
- Renewables penetration in the first half of 2025 reached 40% in the NEM, up from 35% in the first half of 2024.
- Discharge from utility-scale batteries reached a high of 0.6% of supplied electricity in the NEM.
- We approved 1.5 gigawatts (GW) of large-scale capacity in Q2, with a total of 2.6 GW approved so far in 2025. Our projection for approvals in 2025 has been revised upward to 3.0-3.5 GW.
- Capacity reaching final investment decision (FID) has been modest this year after a strong 2024, but most projects from Tender 1 of the Capacity Investment Scheme (CIS) have made progress toward FID. Future tenders are expected to support more capacity and be faster, with the CIS expanding to 40 GW by 2030 and using a single stage bid process.
- Large-scale generation certificate (LGC) prices have declined in Q2 due to supply exceeding demand, with the future price for 2028 vintage LGCs at $10.
- Non-RET demand for LGCs has been strong in 2025, with 7.2 million surrenders in the first half of the year. We expect total non-RET LGC surrenders to be at the upper end of its 2025 projection of 12.5 - 15 million, with potential for more surrenders in response to low LGC prices and as entities seek to meet their 2025 climate commitments.
- The Cheaper Home Batteries Program had a strong start, receiving more than 55,000 applications to the middle of September 2025, representing over one gigawatt-hour (GWh) of capacity. Of these applications, nearly 41,000 had been validated, representing over 700 megawatt-hours (MWh) of capacity.
- 45% of batteries are being installed concurrently with either a new solar PV system or an upgrade to an existing solar PV system, suggesting the Cheaper Home Batteries Program may accelerate solar PV installations.
- Solar PV installed in the first half of 2025 is down 12% to 1.3 GW compared to the first half of 2024, which appears to have been driven by the Cheaper Home Batteries Program causing delays in consumers deciding to install systems, and new systems installed with batteries not being commissioned until after the program commenced.
- It is expected that PV capacity will recover to the end of the year as the effects of the Cheaper Home Batteries Program play out, with 2.9 to 3.2 GW of capacity still anticipated for 2025.
- 2025 Australian carbon credit unit (ACCU) issuances remain on track to meet the projected range of 19 to 24 million ACCUs with the first half of 2025 seeing a record issuance of 9.5 million ACCUs.
- The Department of Climate Change, Energy, the Environment and Water (DCCEEW) has made progress on a new landfill gas method, two new proposed savanna fire management methods, and a new abatement calculation tool for savanna fire management.
- The CER is working on migrating ACCUs from the Australian National Registry of Emissions Units (ANREU) to the new Unit and Certificate Registry in late 2025. In the new registry ACCUs will also be given attributes for more information.
- The CER has approved the first Nature Repair Market project and is assessing 2 more applications.
Click on the image below to download a full-sized version.

Ways to read the report
Data workbook
QCMR data workbook - June Quarter 2025 ( 3.21 MB xlsx )The QCMR data workbook – June Quarter 2025 contains the data underlying the figures in the report as well as additional data.
Updated: 26 September 2025
Changes
Updated:
- Figure 2.2 - Large-scale generation certificate (LGC) reported spot and forward prices
- Figure 2.3 - Large-scale generation certificate (LGC) spot price
- Figure 2.6 - Final investment decision capacity in gigawatts (GW) for large-scale renewable generation
- Figure 2.7 - Large-scale generation certificate (LGC) holdings (in millions) by market participation
- Figure 3.6 - Small-scale technology certificate (STC) reported spot and clearing house prices
New:
- Figure 1.2 - Estimated Australian carbon credit unit (ACCU) issuances in 2025
- Figure 1.5 - Safeguard Mechanism credit unit (SMC) holdings (in millions) by market participation
- Figure 1.6 – Australian carbon credit unit (ACCU) voluntary, compliance, and government cancellations
- Figure 1.7 - Australian carbon credit unit (ACCU) safeguard surrenders
- Figure 1.8 - Generic Australian carbon credit unit (ACCU) and Safeguard Mechanism credit unit (SMC) volume weighted average spot price
- Table 1.1 - Australian carbon credit units (ACCUs) issued to and the number of projects claiming for the first time
- Figure 2.5 - Capacity Investment Scheme (CIS) Tender project capacity by development stage as of 31 July 2025
- Figure 3.1 - Small-scale cumulative passed battery capacity installed by state and territory in kilowatt hours (kWh)
- Figure 3.2 - Distribution of passed battery usable capacity in 5-kilowatt hour (kWh) ranges
- Figure 3.3 - Distribution of battery installations by type
- Figure 3.4 - Lags between battery installation and associated solar PV installation, by type
Removed:
- Figure 1.2 - Generic Australian carbon credit unit (ACCU) volume weighted average spot price
- Figure 1.6 - Australian carbon credit unit (ACCU) cancellations/surrenders by demand source
Media release
Read the media release: Cheaper home batteries surpass Australia's biggest battery