
Small-scale technology certificates (STCs)
On this page
Market dynamics
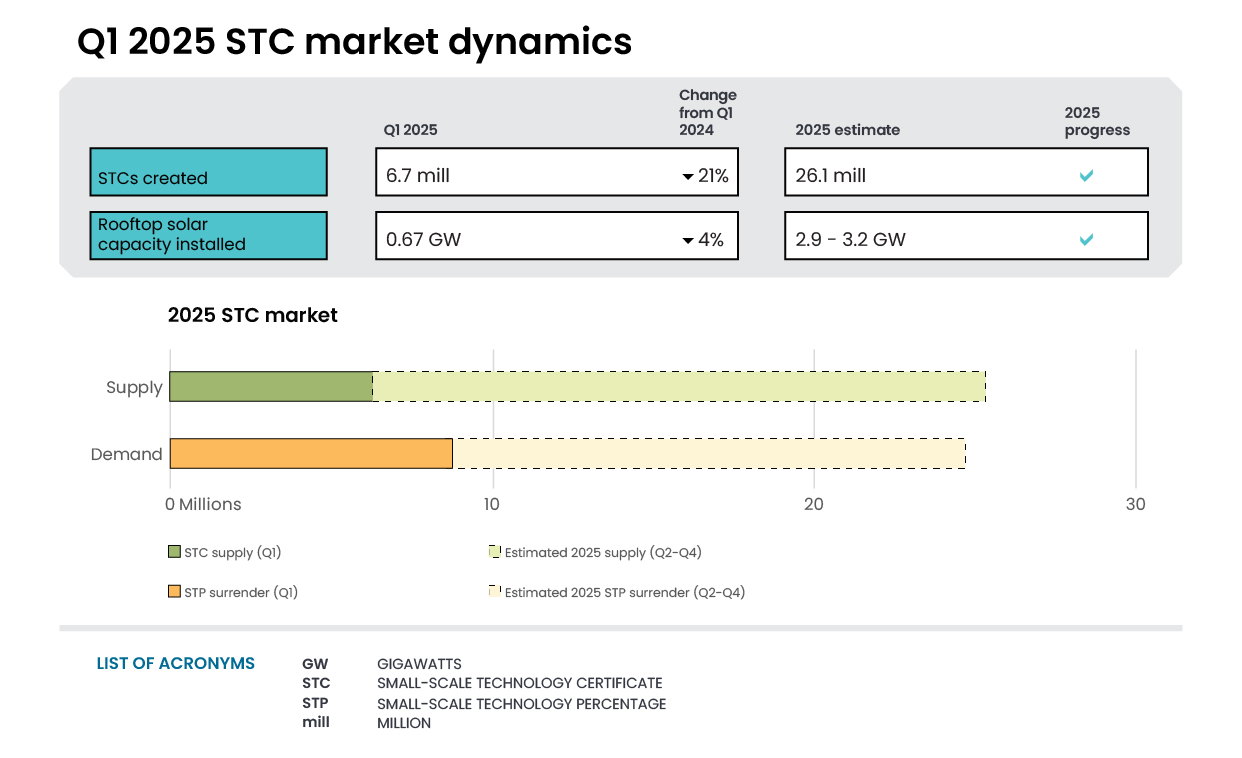
STC creations exceeded the rate required to meet the 2025 small-scale technology percentage (STP). In Q1 2025, the average weekly STC creation rate was over 509,000. The 2025 STP target is 26.1 million STCs, equivalent to creations of 502,000 STCs per week.
Throughout the quarter, 6.7 million STCs were created and 7.0 million were surrendered to meet the Q4 2024 surrender requirement due 14 February 2025. With a starting Q1 stock of 3.5 million, this left 2.9 million in the REC Registry after the surrender date.
The STC spot price remained at $39.90 for most of Q1 2025. This was due to the Clearing House remaining in deficit for most of the quarter, moving into a surplus toward the end of the quarter.
Shortly after the end of Q1, activity in the market increased as entities prepared for the Q1 surrender deadline on the 28 April. A total of 8.8 million STCs, equivalent to 35% of the annual compliance requirement were surrendered. Immediately following this surrender period, there were 1.4 million STCs remaining in the REC Registry. Between 15 February and the 28 April surrender, 6.6 million STCs were purchased from the Clearing House, pushing it into deficit by 4.6 million. As a result, the STC market price moved closer to the market cap of $40.
Cheaper home batteries to be delivered through the SRES
The Australian Government has announced the Commonwealth Cheaper Home Batteries Program. Batteries installed with new or existing solar PV systems will be eligible to create STCs from 1 July 2025, which will provide a discount of around 30% of the typical battery cost. The program requires regulations being in place. Further details on eligibility and the rate of STCs that may be created per kilowatt-hour of battery capacity are available on DCCEEW’s website – see Cheaper Home Batteries Program.
STCs equivalent to the additional creations for batteries will be regularly purchased by government through the Clearing House. The obligations of liable entities under the SRES – generally electricity retailers – will not be affected, so the cost of the Cheaper Home Batteries Program will not be passed through to electricity prices.
The SRES battery rebate will help to reduce the payback period for batteries. Payback times for home batteries vary based on location, electricity tariff, battery cost and model, and household energy consumption—especially at night. According to market sources, a 10 kWh battery installed for $8,500 after the SRES rebate and paired with a solar system larger than 7kW could deliver around $1,000 in annual savings in Sydney. Under this example, the SRES rebate would reduce the payback period from around 12 years to 8 before any further state government incentives. Payback times will be shorter still where state or territory incentives are available, such as in NSW, NT, WA, and the ACT.
In addition to substantial reductions in household energy bills, batteries can also help improve grid stability. Australia’s world-leading solar penetration can cause events when more rooftop solar generation is exported than there is demand, making the system frequency too high. Storing excess PV output for later use rather than export could mean avoiding the use of backstop mechanisms that temporarily dial down or disconnect rooftop solar systems as a last resort, and charges by some network distributors for households exporting energy to the grid. Increasing volumes of household storage also help reduce the curtailment of other large-scale renewables by network operators to maintain power system security.
The information collected by the CER under the Cheaper Home Batteries Program will allow for a more accurate picture of battery uptake. Data and relevant insights will be included in future QCMRs and published on the CER website.
Description
This figure shows the weekly supply of STCs in 2025 in weekly intervals from week 1 to week 14 as columns. It also shows the required weekly supply of STCs (501,923) to meet the 2025 STP as a straight horizontal line.
This figure is interactive. Hover over/tap each bar to see the number of STCs. Hover over/tap along the line to see the required weekly supply. Click/tap on the items in the legend to hide/show data in the figure.
Small print
Required STC supply refers to the estimated number of STCs to be created (26.1 million) to meet the annual STP liability and under/over supply from previous years. Where weeks are spread across multiple months, the month label refers to the month as at the last date of the relevant quarter. The final week may be significantly lower than prior weeks if the quarter ends during the week. For example, Q1 2025 ended on Monday 31 March so the final ‘week’ of March contains only one day.
Small-scale technology certificate (STC) reported spot and clearing house prices
Note: This figure is not interactive.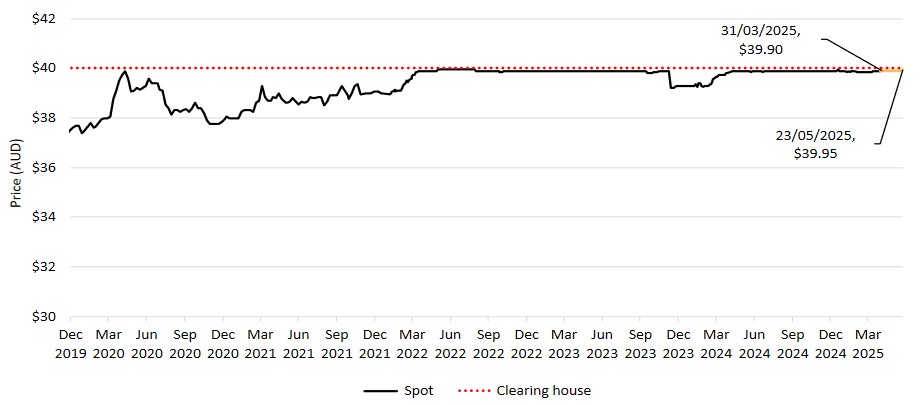
Description
This figure shows the daily closing STC spot price and STC clearing house price from 1 December 2019 to 23 May 2025. The closing STC spot price on 23 May was $39.95 and the final STC spot price for Q1 was on 31 March 2025 at $39.90.
Small print
Pricing data is complied from trades reported by CORE markets and may not be comprehensive. Prices are shown from 1 December 2019 to 23 May 2025.
Read more about buying and selling STCs, including through the clearing house.
Soft start to 2025, with substantial pick-up expected
There has been a 4% decline in capacity and a 10% decline in installations when comparing Q1 2025 to Q1 2024. This national result was largely driven by reductions in the 3 states with the largest solar PV markets: NSW, QLD, and Victoria. Several factors may have contributed to the Q1 declines, including severe weather from Cyclone Alfred in southeast Queensland and northern NSW. Based on the experience with severe weather such as localised hailstorms, we expect the bulk of replacement installations from Cyclone Alfred to be creating STCs in Q3 2025.
More broadly, we expect the introduction of the Cheaper Home Batteries program to increase installations. The CER expects the program will incentivise installation of new PV systems; an uplift in system size for those who were already considering installing PV systems; and replacement systems for older systems. This is supported by current market intelligence suggesting that order books for installers have been improving since the program was announced.
Looking back to 2024, installed capacity looks to be a near record, with more than 3.1 GW of rooftop capacity installed. Given the 12-month period for creating STCs, the CER lag-adjusts actual estimates based on recent historical creation to estimate the final outcomes. Lag adjustments indicate 2024 capacity will reach a record 3.2 GW.
Description
This figure shows the installed capacity of small-scale rooftop solar installations per quarter for the period 1 January 2019 to 31 March 2025. This figure also shows the number of installations per quarter during the period as a line.
This figure is interactive. Hover over/tap each bar to see the installed capacity. Hover over/tap along the line to see the number of installations. Click/tap on the items in the legend to hide/show data in the figure.
Small print
Small-scale rooftop solar systems must have a capacity of less than 100 kilowatts (kW). A 12 month creation period for registered persons to create small-scale technology certificates applies under the Renewable Energy (Electricity) Regulations (2001). Data for installations and installed capacity in 2024 and quarter 1 of 2025 have been lag-adjusted to account for the 12 month creation rule and are estimates only. Data is subject to change and totals may not sum due to rounding.
Average system sizes continue to increase
In the past year, the average system size for residential solar installations has grown from 9.3 kW in Q1 2024 to 9.9 kW in Q1 2025. This increase is driven by growth in the number of large residential and commercial installations within the 10-15 kW and 15-40 kW ranges, respectively. Installed capacity remains on track to fall within our projection of 2.9 GW to 3.2 GW.
The Cheaper Home Batteries Program may have an added impact on average system size, as generating extra energy to store and use later can improve the return on investment for larger systems.
Description
This figure shows the proportion of rooftop solar systems installed per quarter under the Small-scale Renewable Energy Scheme (SRES) by capacity band for the period 1 January 2019 to 31 March 2025. The capacity bands are as follows: 0-5 kW, 5-10 kW, 10-15 kW, 15-40 kW, and 40-100 kW.
This figure is interactive. Hover over/tap each segment to see each proportion of installed capacity. Hover over/tap along the line to see the average system size. Click/tap on the items in the legend to hide/show data in the figure.
Small print
A 12 month creation period for registered persons to create small-scale technology certificates applies under the Renewable Energy (Electricity) Regulations (2001). Data as at 31 March 2025. Capacity band data has not been lag-adjusted. Average system size data has been lag-adjusted. Data is subject to change. Totals may not sum to 100% due to rounding. Bands have been altered in this release to better reflect the distribution of systems.
Weaker demand for air source heat pumps continues
Data as of 31 March showed that around 18,300 air source heat pumps (ASHPs) were installed Q1 2025. When compared to Q1 2024, installations are down 34% from around 27,800. This decline is wholly attributed to a sharp reduction in NSW installation rates. NSW ASHP installations have fallen to around 1,800, compared to almost 11,500 in Q1 2024. This shift has been attributed to tightening of eligibility requirements for the Household Energy Saving Upgrades scheme as discussed in previous QCMRs.
Description
This figure shows the number of air source heat pump installations each quarter under the Small-scale Renewable Energy Scheme (SRES) by state and territory for the period 1 January 2019 to 31 March 2025. It also shows the number of STCs validated from these installations over this period as a line.
This figure is interactive. Hover over/tap each segment to see the number of installations. Hover over/tap along the line to see the number of STC validations. Click/tap on the items in the legend to hide/show data in the figure.
Small print
Where cell values are less than 10 data have been modified due to privacy considerations. In the figure these values appear as 10.
A 12 month creation period for registered persons to create small-scale technology certificates (STCs) applies under the Renewable Energy (Electricity) Regulations (2001). STC validation data has been rounded to the nearest thousand. Data as at 31 March 2025 and has been lag-adjusted. Data is subject to change.
Small commercial solar in the SRES: trends and opportunities
Solar PV systems between 15 kW and under 100 kW are considered 'small commercial'. While more than 4 million solar PV systems have been installed under the SRES, the overwhelming majority have occurred in the residential sector (15 kW or below). Data from 2024 shows that just 7% of installations and 20% of capacity were in the small commercial range.
Small commercial systems are installed by businesses as well as other entities such as public schools or hospitals. The payback period for commercial systems is typically in the 2-5 year range, making the investment potentially attractive for many entities. As most businesses operate during the day, installing storage is less likely to be cost effective without the emergence of attractive offers to export excess daytime generation for other consumers to use after business hours.
While small commercial PV can be financially attractive, other barriers may contribute to relatively low take-up. The Clean Energy Council identified business ownership as a key barrier, as businesses leasing their properties must negotiate with their landlords. Commercial sites are more complex than residential, requiring licensed EPC (engineering, procurement, and construction) installers to manage larger projects, and meet specific regulatory and compliance requirements for commercial installations including approvals from distribution network service providers.
Description
This figure shows the distribution of small-scale rooftop installations by 5 kilowatt capacity bands starting at 15-20 kilowatt through to 95-100 kilowatt installations between 2020 and 2024 as a line.
This figure is interactive. Hover over/tap along the line to see the number of installations.
Small print
Small-scale rooftop solar systems must have a capacity of less than 100 kilowatts (kW). A 12 month creation period for registered persons to create small-scale technology certificates applies under the Renewable Energy (Electricity) Regulations (2001). This chart refers to systems 15kW and above as 'small commercial'. Data is subject to change.
CER data from 2020 to 2024 show that commercial systems 20 kW, 40 kW and 100 kW are the most likely system sizes to be installed. 20 kW systems typically meet the energy needs of the average small commercial buyer.
The small peak in installation around 35 to 40 kW systems is because these systems were previously at the capacity limit that could be installed without electrical safety requirements that require a grid protection unit to minimise the impacts of fluctuations in voltage, frequency and other parameters on the electrical grid. This extra piece of hardware typically costs an additional $5,000, making this system size range less financially attractive. As a result, historical installations fall sharply after 40 kW. In August 2024, changes to electrical safety standards and guidelines lifted system threshold for a grid protection unit to 200 kW. As such, this barrier to installations above 35 to 40 kW has been removed.
As systems larger than 100 kW must be accredited as renewable energy generators under the Large-scale Renewable Energy Target scheme rather than receiving a rebate via STCs under the SRES, the clustering just under 100 kW is likely influenced by policy as well as economics.
Overall, if barriers can be reduced while maintaining appropriate power system security, the small commercial segment represents an opportunity for businesses to save on energy bills while contributing to reducing Australia’s emissions.
Supplementary charts
Description
This figure shows small-scale rooftop solar replacements as a proportion of total installations by state and territory over time.
This figure is interactive. Hover over/tap each line to see the proportion of replacements. Click/cap on the items in the legend to hide/show data in the figure.
Small print
Replacements represent small-scale rooftop solar systems categorised in the Renewable Energy Certificate (REC) Registry as replacements. The installation type data field was added to the REC Registry in late 2020, and was made mandatory from 28 January 2021. Data as of 31 March 2025 and has not been lag-adjusted. Data is subject to change due to the 12 month creation rule.
Description
This figure shows the rooftop solar capacity installed under the Small-scale Renewable Energy Scheme (SRES) by state and territory over time.
This figure is interactive. Hover over/tap each line to see the capacity. Click/cap on the items in the legend to hide/show data in the figure.
Small print
A 12 month creation period for registered persons to create small-scale technology certificates applies under the Renewable Energy (Electricity) Regulations (2001). Data for installations in 2024 to 2025 have been lag-adjusted to account for the 12 month creation rule and are estimates only. There may be small differences between the sum of lag-adjusted state and territory estimates and the national lag-adjusted estimate. Data is also subject to change and totals may not sum due to rounding.
Description
This figure shows the volume of STCs transacted and the number of transactions, excluding STC clearing house transactions, over time.
This figure is interactive. Hover over/tap over each bar to see the number of STCs. Hover over/tap each line to see number of transactions. Click/cap on the items in the legend to hide/show data in the figure.
Description
This figure shows STC supply over time.
This figure is interactive. Hover over/tap each bar to see the number of STCs.