
Small-scale Renewable Energy Scheme
On this page
- Battery installations exceed expectations in 2025
- Market dynamics
- Recovery in small-scale solar in Q4 2025 with stronger 2026 expected
- A moderate year for ASHPs
Battery installations exceed expectations in 2025
The Cheaper Home Batteries Program commenced on 1 July 2025 and has exceeded expectations in its first 6 months. In Q4 2025, around 109,000 validated batteries were approved, adding a further 2.9 GWh of capacity; 76% higher than the 1.7 GWh installed and validated in Q3 2025.
Across the program’s first 6 months, over 193,000 valid batteries were installed, totalling 4.6 GWh of capacity. This represents more storage capacity than the 12 largest in-service large-scale batteries in the NEM combined. The number of validated 2025 installations and the associated capacity will continue to rise over the next 12 months as applications are made and assessed.
Description
This figure shows the quarterly cumulative installed capacity of validated small-scale battery installations per state following the commencement of the Cheaper Home Batteries Scheme on 1 July 2025.
This figure is interactive. Hover over/tap each data point to see the validated installed battery capacity. Click/tap on the items in the legend to hide/show data in the figure.
Small print
A 12 month creation period for registered persons to create small-scale technology certificates applies under the Renewable Energy (Electricity) Regulations (2001). Data is subject to change due to the 12 month creation rule. Totals may not sum due to rounding.
Our analysis of the first two quarters of 2025 data from the Cheaper Home Batteries Program shows that:
- More than 98% of batteries have been installed by households, with businesses accounting for most of the remainder.
- Average usable capacity has increased each quarter for both business and household installations. The average household battery capacity installed in Q4 2025 was 26.8 kWh, up from 19.5 kWh in Q3. Batteries installed by businesses have consistently been larger but have also grown. The average business battery capacity installed in Q4 2025 was 36.2 kWh, up from 31.4 kWh in Q3.
- For business installations, batteries in 45 – 50 kWh usable capacity range were the most common, whereas household installations were dominated by batteries in the 15 – 20 kWh usable capacity category.
- Around 51% of all battery installations were retrofits to addresses with existing small-scale solar systems, with no upgrade to the solar system. The remainder were split fairly evenly between batteries installed concurrently with an upgrade to an existing small-scale solar system and those installed alongside a new system. Since the introduction of the Cheaper Home Batteries Program, around 60% of small-scale solar PV installations have been installed concurrently with a battery.
Description
This figure shows the distribution of validated small-scale battery installations from 1 July 2025 to 31 December 2025 at residential buildings across usable capacity in 5-kilowatt hour (kWh) ranges, following the commencement of the Cheaper Home Batteries Scheme on 1 July 2025.
This figure is interactive. Hover over/tap each bar to see the number of validated residential battery installations.
Small print
A 12 month creation period for registered persons to create small-scale technology certificates applies under the Renewable Energy (Electricity) Regulations (2001). Data is subject to change due to the 12 month creation rule.
Systems with capacities on the border between ranges are included in the higher range. For example, a 15 kWh system would be included in the 15-20 kWh range.
Description
This figure shows the distribution of validated small-scale battery installations from 1 July 2025 to 31 December 2025 at non-residential buildings across usable capacity in 5-kilowatt hour (kWh) ranges, following the commencement of the Cheaper Home Batteries Scheme on 1 July 2025.
This figure is interactive. Hover over/tap each bar to see number of validated non-residential battery installations.
Small print
A 12 month creation period for registered persons to create small-scale technology certificates applies under the Renewable Energy (Electricity) Regulations (2001). Data is subject to change due to the 12 month creation rule.
Systems with capacities on the border between ranges are included in the higher range. For example, a 15 kWh system would be included in the 15-20 kWh range.
Description
This figure shows the distribution of validated small-scale battery installations from 1 July 2025 to 31 December 2025 by installation type, following the commencement of the Cheaper Home Batteries Scheme on 1 July 2025.
This figure is interactive. Hover over/tap each section to see the percentage of validated battery installations. Click/tap on the items in the legend to hide/show data in the figure.
Small print
A 12 month creation period for registered persons to create small-scale technology certificates applies under the Renewable Energy (Electricity) Regulations (2001). Data is subject to change due to the 12 month creation rule.
Category definitions
Retrofit installation
Battery installations that were installed after 30 June 2025 and that were installed more than 90 days after the associated solar PV installation.
Concurrent installation with new solar PV
Battery installations that have occurred either during the period 6 April 2025 - 30 June 2025, or that were installed within 90 days of the associated solar PV installation. The solar PV installation was a new installation for the address.
Concurrent installation with upgraded solar PV
Battery installations that have occurred either during the period 6 April 2025 - 30 June 2025, or that were installed within 90 days of the associated solar PV installation. The solar PV installation was a replacement, extension, or addition for an existing solar PV system at the address.
Description
This figure shows the distribution of small-scale solar system installations from 1 July 2025 to 31 December 2025 by whether or not they were installed alongside a battery, following the commencement of the Cheaper Home Batteries Scheme on 1 July 2025.
This figure is interactive. Hover over/tap each bar to see the STC supply. Hover over/tap along the line to see the required weekly supply of STCs to meet the STP. Click/tap on the items in the legend to hide/show data in the figure.
Small print
A 12 month creation period for registered persons to create small-scale technology certificates applies under the Renewable Energy (Electricity) Regulations (2001). Data is subject to change due to the 12 month creation rule.
Category definitions
Installed with a battery
Small-scale solar PV systems that were installed between 30 June 2025 and 31 December 2025 and that were installed with a battery.
Installed without a battery
Small-scale solar PV systems that were installed between 30 June 2025 and 31 December 2025 and that were installed without a battery.
On 5 February 2026, the Australian Government made regulations giving effect to program adjustments to ensure the discount for battery systems remains appropriate across system sizes. The changes will take effect from 1 May 2026 and include:
- Adjustments to the amount of STCs generated per kWh of useable capacity to align with falling battery costs over time.
- A tiered system of support based on battery size, with the aim of maintaining around 30% discount for battery systems at each capacity. This includes a tapered STC factor, with batteries sized from 14 to 28 kWh receiving 40% fewer STCs than smaller batteries and batteries sized above 28 kWh receiving 85% fewer STCs.
In 2026, we anticipate that between 350,000 and 520,000 batteries will be installed, for a combined storage capacity of 8 GWh to 12 GWh. Due to the Cheaper Home Batteries Program still being new and the consequent limitations on data, as well as the incoming policy changes to the program on 1 May 2026, estimating battery uptake at this stage is difficult.
We will monitor the performance of the Cheaper Home Batteries Program, including the effects of the 1 May 2026 changes, throughout the year and provide updates to our projections as needed in future QCMRs.
The success of the batteries program represents an opportunity to help transform how electricity systems operate. The total capacity of batteries installed under the program is already material. As we observed in the September quarter 2025 QCMR, if battery installation results were sustained over several years, a sizeable component of battery storage needs could potentially be met through a distributed energy system controlled by households. This would empower households and create increased competition and change in the retail energy market.
As the use of distributed energy resources including household solar panels and batteries grows, another key step in the transition will be in unlocking the benefits of this infrastructure for the broader grid. According to the Australian Energy Market Operator’s draft 2026 Integrated System Plan, having distributed energy resources bundled and coordinated through virtual power plants (VPPs) or vehicle-to-grid (V2G) charging of electric vehicles would contribute to system reliability and security, and would avoid up to $7.2 billion being spent on additional grid-scale storage in the National Electricity Market (NEM) through to 2050.
Costs associated with network enhancement and transmission could also be reduced, providing further benefits for electricity consumers. To realise the full consumer benefits of these and other distributed energy resources, a range of new technical regulatory functions, such as nationally consistent technical standards for distributed energy resource devices, will be essential. In December 2025, the Energy and Climate Change Ministerial Council proposed the CER as the preferred body to take on new technical regulatory functions for distributed energy resources.
Market dynamics
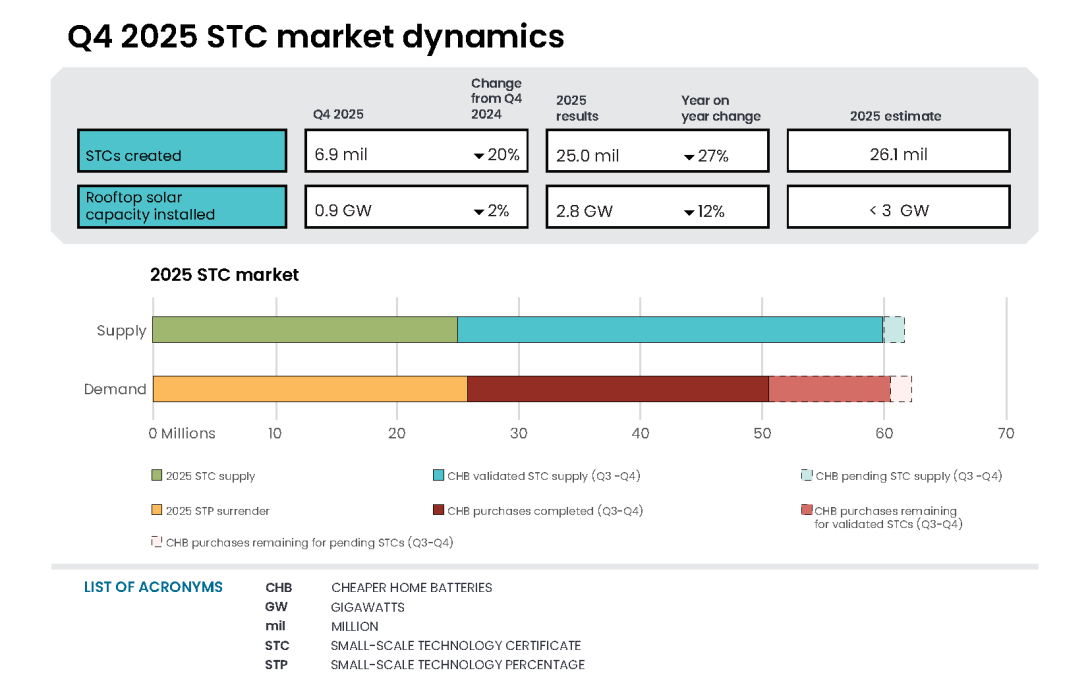
In Q4 2025, 6.9 million STCs were created, bringing the 2025 total to 25.0 million. These figures exclude STCs created as part of the Cheaper Home Batteries Program which are purchased by government rather than by entities with compliance obligations under the SRES. On average, around 472,000 STCs were created per week throughout 2025. This was 5.9% below the average of around 502,000 required to meet the compliance demand of 26.1 million set for the 2025 STP, largely attributable to installers shifting capacity to solar battery retrofits in the early months of the Cheap Home Batteries Program.
For the Q4 2025 compliance period, 4.3 million STCs were surrendered by the 16 February 2026 deadline, with no liable entities going into shortfall. This brings total STC surrenders for the 2025 compliance year to 26.0 million.
Description
This figure shows the weekly supply of STCs in 2025. It also shows the required weekly supply of STCs (501,923) to meet the 2025 STP.
Small print
Required STC supply refers to the estimated number of STCs to be created (26.1 million) to meet the annual STP liability in 2025. Some weeks are spread across multiple months, the month label refers to the month as of the end of the week. Weeks 1 and 53 are significantly lower than other weeks in the year due to them being shorter as a result of the start and end of the year. Week 1 consists of 5 days from Wednesday 1 January to Sunday 5 January, Week 53 consists of 3 days from Monday 29 December to Wednesday 31 December.
On 5 February 2026, the STP for 2026 was set at 11.67%, down from 13.89% in 2025. The STP is set by the Minister for Climate Change and Energy each year and aims to set demand to match projected STC creations. That is, all certificates expected to be created in a year are required to be surrendered by liable entities, considering any over or underachievement from the previous year.
The reduction in the STP is primarily due to a downward adjustment to account for STC creations being below STC surrender requirements in 2025. Increased wholesale electricity purchases by liable entities also contributed to the declining percentage. The 2026 STP is based on an estimate of 24.1 million STC creations in 2026.
The STC spot price remained at $39.90 for most of 2025 before edging down slightly to $39.85 at year-end. This softening reflected movements in the STC clearing house, which spent much of the year in deficit but shifted into surplus toward the end of 2025. Purchases from the STC clearing house were 9.4 million in Q4 2025, exceeding purchases in Q4 2024 by 60%, with strong purchase activity continuing into early 2026 ahead of the 16 February 2026 deadline for Q4 2025 STC surrenders.
Small-scale technology certificate (STC) reported spot and clearing house prices
Note: This figure is not interactive.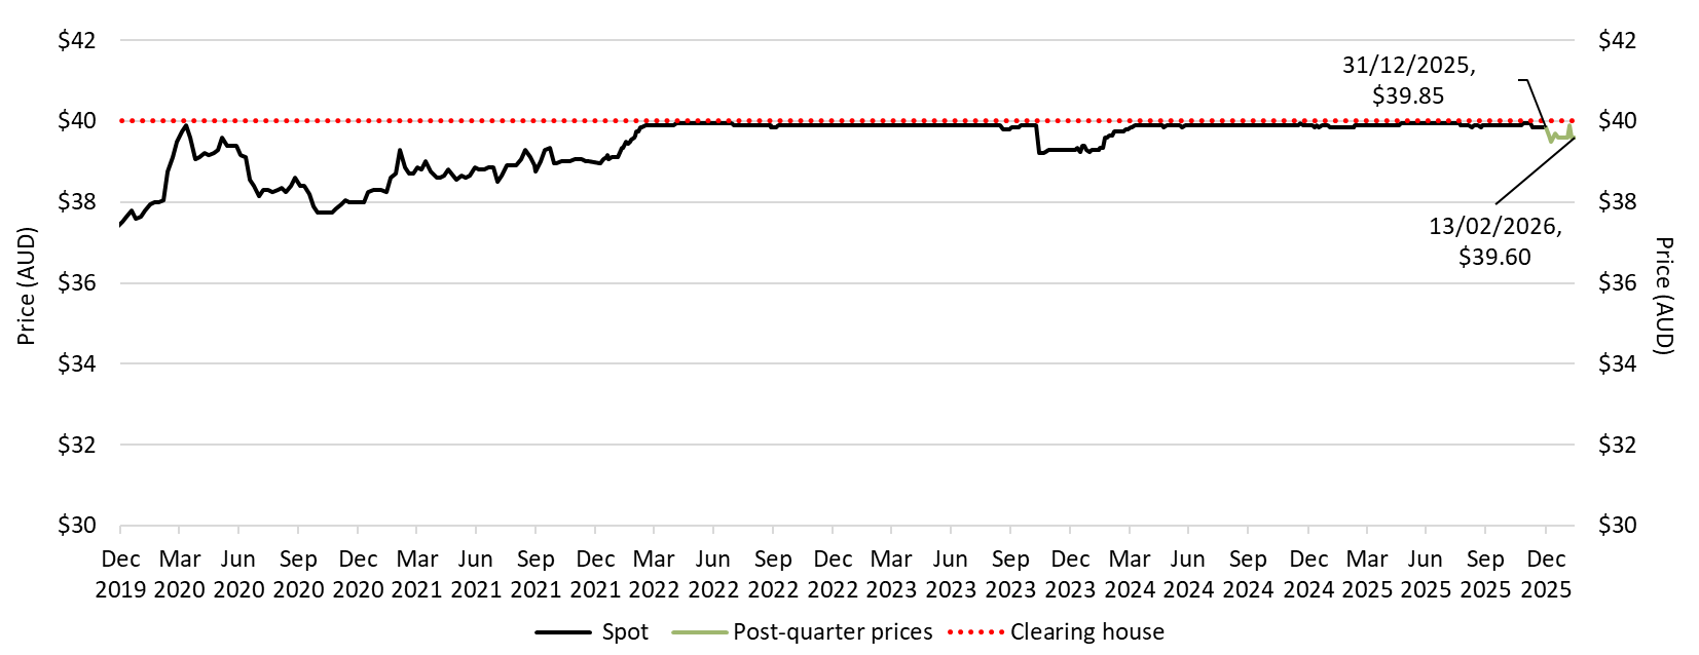
Description
This figure shows the daily closing STC spot price over time. It also shows the STC clearing house price.
Small print
Pricing data is complied from trades reported by CORE markets and may not be comprehensive. Prices are shown from December 2019 to 13 February 2026. The last spot price recorded for the quarter is labelled.
Read more about buying and selling STCs, including through the clearing house.
Recovery in small-scale solar in Q4 2025 with stronger 2026 expected
PV installation and total capacity in 2025 was softer than 2024, primarily driven by the success of the Cheaper Home Batteries Program. In Q4 2025, small-scale solar capacity recovered to 855 MW, bringing total capacity installed in the year to 2.8 GW. This is a reduction of 12% from 3.2 GW in 2024. The number of installations also fell 16% year-on-year; dropping from 319,000 to 269,000 systems.
Market intelligence indicates that the popularity of batteries has diverted installer resources toward retrofit battery installations and away from the installations of standalone small-scale solar systems. The strong recovery in installed capacity observed in Q4 2025 suggests that these pressures may be beginning to ease. The Cheaper Home Batteries Program is likely to incentivise greater small-scale solar uptake into 2026 as consumers look to maximise the benefit of their batteries by upgrading their existing small-scale solar systems or installing new and larger systems.
Description
This figure shows the installed capacity in megawatts (MW) and the number of small-scale rooftop solar installations over time.
This figure is interactive. Hover over/tap each line to see the proportion of replacement installations. Click/tap on the items in the legend to hide/show data in the figure.
Small print
Small-scale rooftop solar systems must have a capacity of less than 100 kilowatts (kW). A 12 month creation period for registered persons to create small-scale technology certificates applies under the Renewable Energy (Electricity) Regulations (2001). Data for installations and installed capacity in the past 12 months have been lag-adjusted to account for the 12 month creation rule and are estimates only. Data is subject to change and totals may not sum due to rounding. Non-lag adjusted figures are available on Small-scale installation postcode data.
Capacity installed fell less significantly than the number of systems installed, as average system sizes continued to increase. The average small-scale solar system grew from 9.9 kW in 2024 to 10.3 kW in 2025. This increase in system size was driven by increased popularity of systems sized 15-40 kW. Systems in this range grew to 19% of installed capacity in 2025 from 14% in 2024. Systems sized 5-10 kW saw a noticeable decline in popularity, representing 33% of capacity installed in 2025, down from 38% in 2024.
Description
This figure shows the proportion of rooftop solar systems installed under the Small-scale Renewable Energy Scheme (SRES) by capacity band and the average size of rooftop solar systems installed under the SRES over time.
This figure is interactive. Hover over/tap over each section to see the number of installations. Hover over/tap along the line to see number of associated STC validations. Click/tap on the items in the legend to hide/show data in the figure.
Small print
A 12 month creation period for registered persons to create small-scale technology certificates applies under the Renewable Energy (Electricity) Regulations (2001). Capacity band data has not been lag-adjusted. Average system size data has been lag-adjusted. Data is subject to change. Totals may not sum to 100% due to rounding.
Given the recovery in small-scale solar observed in Q4 2025, and the incentives for larger systems from the Cheaper Home Batteries Program, we expect that between 3.0 and 3.7 GW of small-scale solar capacity will be installed in 2026. The 2026 STP has been set to a level consistent with 3.4 GW of capacity being installed in 2026, which would be above the current record of 3.2 GW set in 2021.
With limited data on how battery uptake may influence solar demand over time, there is a higher-than-usual level of uncertainty in our projections. We will continue to monitor consumer behaviour and installation trends closely and will update our projections in future QCMRs as more information becomes available.
A moderate year for ASHPs
In Q4 2025, around 23,000 ASHPs were installed, bringing total installations in 2025 to around 91,000. This represents an 18% decrease in installations compared to the 111,000 installed in 2024.
The decline in ASHP installations was driven by a 64% drop in NSW in 2025 compared to 2024, from around 35,000 to around 13,000. This was driven by a change in eligibility in the state-based scheme. A significant decline in installations was also seen in SA, which fell 15% year-on-year from around 4,500 in 2024 to around 3,800 in 2025.
Victoria led the nation with an estimated 52,000 validated ASHP installations in 2025, recording a 4.4% increase compared with the 50,000 installed in 2024. The state or territory with the largest proportional increase in installations was Queensland, where installations increased 12% from around 9,900 to 11,000.
Description
This figure shows the number of air source heat pump (ASHP) installations under the Small-scale Renewable Energy Scheme (SRES) by state and territory over time. It also shows the number of STCs validated from these installations over time. Totals may not sum due to rounding applied to NT.
This figure is interactive. Hover over/tap each section to see the proportion of rooftop installations. Hover over/tap along the line to see the average rooftop solar system size. Click/tap on the items in the legend to hide/show data in the figure.
Small print
Where cell values are less than 10, data have been modified due to privacy considerations. In the figure these values appear as 10.
There are no STC validations in 2010 as this was before the start of the Small-scale Renewable Energy Scheme.
A 12 month creation period for registered persons to create small-scale technology certificates (STCs) applies under the Renewable Energy (Electricity) Regulations (2001). Data for installations for the past 12 months have been lag-adjusted to account for the 12 month creation rule and are estimates only. STC validation data has been rounded to the nearest thousand. Data is subject to change. Non-lag adjusted figures are available on Small-scale installation postcode data.