
On this page
- Strong first quarter of the Cheaper Home Batteries Program
- Cheaper Home Batteries Program softens standalone PV uptake, but pickup expected
- STC market dynamics
- Air source heat pump installations settling from record years
- Supplementary figures
Strong first quarter of the Cheaper Home Batteries Program
During its first quarter, the Cheaper Home Batteries Program exceeded expectations, with more than 54,000 batteries approved under the scheme for a combined capacity of 1 GWh. The strength of the program has continued post-quarter – looking at both the pending and approved applications, more than 124,000 batteries representing 2.7 GWh of capacity were installed by 14 November 2025. Based on the success of the program to date, we anticipate around 175,000 valid batteries to be installed by the end of 2025, representing around 3.9 GWh of useable capacity. This is more capacity than the 5 biggest utility-sized batteries currently operational in the NEM.
Description
This figure shows the monthly cumulative installed capacity of validated small-scale battery installations per state following the commencement of the Cheaper Home Batteries Scheme on 1 July 2025.
This figure is interactive. Hover over/tap each section to see installed capacity. Click/tap on the items in the legend to hide/show data in the figure.
Small print
A 12 month creation period for registered persons to create small-scale technology certificates applies under the Renewable Energy (Electricity) Regulations (2001). Data is subject to change due to the 12 month creation rule. Totals may not sum due to rounding.
Our analysis Q3 2025 data from the Cheaper Home Batteries Program shows that:
- Over 98% of batteries have been installed by households, with businesses making up most of the remainder. The Cheaper Home Battery Program is available to Australian households, businesses, and community organisations.
- Batteries installed by businesses are larger than batteries installed by households, averaging 28.3 kWh useable capacity. By comparison, household batteries averaged 18.3 kWh.
- The average size of household batteries rose steadily across Q3 2025, starting at 16.6 kWh in July and reaching 19.8 kWh in September.
- Around 53% of all batteries were retrofitted to an address with existing small-scale solar, with no upgrade to the solar system. The remainder were split fairly evenly between batteries installed concurrently with an upgrade to an existing small-scale solar system, and those installed with a new small-scale solar system.
- On average, small-scale solar systems that are being installed concurrently with batteries are larger than those with batteries retrofitted to them, averaging 10.7 kW in capacity compared to 8.6 kW. They are also larger than the average of all small-scale solar systems installed in Q3 2025 (10.4 kW).
If battery installation results were sustained over several years, a sizeable component of battery storage needs could potentially be met through a distributed energy system controlled by households. This would empower households and has the potential to increase competition and create a change in the nature of the retail energy market, driving down costs. Costs associated with network enhancement and transmission could also be reduced, providing further benefits for electricity consumers.
This fleet of distributed household batteries could drive the next step change in annual added rooftop solar capacity and that this combination could be a key element of the 2030 target of 82% renewables. Distributed generation and storage will be predominantly close to major population centres where increasing electricity demand will need to be met because of fuel switching to electricity, new data centres, and population growth. A step change well beyond past expectations may also help mitigate the reliability and price risks of unreliability of old coal fired generation.
Distributed rooftop solar and battery storage, which is predominantly funded by the system owners, could also reduce future costs in both low and high voltage networks.
We will continue to monitor these developments and provide further analysis and commentary in future QCMRs.
Description
This figure shows the distribution of validated small-scale battery installations at residential buildings across usable capacity in 5-kilowatt hour (kWh) ranges, following the commencement of the Cheaper Home Batteries Scheme on 1 July 2025.
This figure is interactive. Hover over/tap each bar to see number of installations.
Small print
A 12 month creation period for registered persons to create small-scale technology certificates applies under the Renewable Energy (Electricity) Regulations (2001). Data is subject to change due to the 12 month creation rule.
Description
This figure shows the distribution of validated small-scale battery installations at non-residential buildings across usable capacity in 5-kilowatt hour (kWh) ranges, following the commencement of the Cheaper Home Batteries Scheme on 1 July 2025.
This figure is interactive. Hover over/tap each bar to see number of installations.
Small print
A 12 month creation period for registered persons to create small-scale technology certificates applies under the Renewable Energy (Electricity) Regulations (2001). Data is subject to change due to the 12 month creation rule.
Description
This figure shows the distribution of validated small-scale battery installations according to the type of battery install, following the commencement of the Cheaper Home Batteries Scheme on 1 July 2025.
This figure is interactive. Hover over/tap each bar to see each proportion of install type. Click/tap on the items in the legend to hide/show data in the figure.
Small print
A 12 month creation period for registered persons to create small-scale technology certificates applies under the Renewable Energy (Electricity) Regulations (2001). Data is subject to change due to the 12 month creation rule.
Installations types are defined as follows:
Retrofit installation
Battery installations that were installed after 30 June 2025 and that were installed more than 90 days after the associated solar PV installation.
Concurrent installation with new solar PV
Battery installations that have occurred either during the period 6 April 2025 - 30 June 2025, or that were installed within 90 days of the associated solar PV installation. The solar PV installation was a new installation for the address.
Concurrent installation with upgraded solar PV
Battery installations that have occurred either during the period 6 April 2025 - 30 June 2025, or that were installed within 90 days of the associated solar PV installation. The solar PV installation was a replacement, extension, or addition for an existing solar PV system at the address.
Market intelligence indicates that the high demand for batteries is continuing, with retailers indicating queues of several months for future installations. The high demand for batteries has been diverting installer resources to battery installations and away from the installation of standalone small-scale solar.
As the Cheaper Home Battery Program matures, we expect that the percentage of batteries being installed concurrently with new or upgraded small-scale solar will increase as the number of households with battery-ready systems declines as they install batteries under the scheme. Some older small-scale solar systems may require upgrades to existing equipment to facilitate battery installations. Older small-scale solar systems are also smaller on average, limiting the benefit of retrofitted battery storage. We anticipate the program will increase household demand for small-scale solar capacity by incentivising households to upgrade these solar systems to facilitate the installation of batteries and maximise their benefit.
Cheaper Home Batteries Program softens standalone PV uptake, but pickup expected
Program data and market intelligence suggest that small-scale solar installations are recovering from the softening observed due to the high demand for batteries. While installations are recovering from their trough, with demand for battery systems dominating, we expect that less than 3 GW of small-scale solar capacity will be installed in 2025.
In Q3 2025, around 63,000 small-scale solar systems were installed, totalling 656 MW of capacity. Post Q3, as of 14 November, a further 37,000 systems and 391 MW in capacity have been installed. This brings total installations in 2025 to 229,000 systems and 2.3 GW of capacity. Year-to-date installations and capacity are down 19% and 16% respectively compared to 2024; from 276,000 installations and 2.7 GW of capacity.
Description
This figure shows the installed capacity and the number of small-scale rooftop solar installations over time.
This figure is interactive. Hover over/tap each line to see the capacity. Hover over/tap along the line to see the number of installations. Click/tap on the items in the legend to hide/show data in the figure.
Small print
Small-scale rooftop solar systems must have a capacity of less than 100 kilowatts (kW). A 12 month creation period for registered persons to create small-scale technology certificates applies under the Renewable Energy (Electricity) Regulations (2001). Data for installations and installed capacity in 2024 and 2025 have been lag-adjusted to account for the 12 month creation rule and are estimates only. Data is subject to change and totals may not sum due to rounding.
Small-scale solar installations started to soften in April, coinciding with the announcement of the Cheaper Home Batteries Program. The number of installations relative to the same time last year troughed in June 2025 at 71% of the 2024 level and is now recovering as the number of trained battery installers rises. Small-scale solar installations were higher for the 3 weeks to mid-November compared to the same period last year. We expect that small-scale solar will continue to recover throughout the rest of 2025 as households look to upgrade existing small-scale solar systems or install new ones to maximise the benefit of installing household batteries.
The average small-scale solar system size continues to increase. In Q3 2025, the average small-scale solar system reached 10.4 kW, up from 10.0 kW in Q3 2024. This increase has been driven by a rise in the proportion of 15 to 40 kW sized systems, with 21% of capacity installed in the quarter coming from systems in this size range, compared to 15% in Q3 2024. Q3 2024 also saw a continuation in the decline in 5 to 10 kW systems, with 33% of capacity coming from systems of that size, down from 37% in Q3 2024. Overall, small-scale solar systems installed in 2025 have averaged 10 kW in capacity.
The proliferation of small-scale solar generation has continued to adjust demand patterns. Australian Energy Market Operator data show minimum operational demand across the NEM (the demand that remains for electricity after subtracting the small-scale solar power) fell to unprecedented lows for a Q3, with New South Wales, Queensland and South Australia all setting new records.
Description
This figure shows the proportion of rooftop solar systems installed under the Small-scale Renewable Energy Scheme (SRES) by capacity band and the average size of rooftop solar systems installed under the SRES over time.
This figure is interactive. Hover over/tap each section to see the proportion of installations. Hover over/tap along the line to see the system size. Click/tap on the items in the legend to hide/show data in the figure.
Small print
A 12 month creation period for registered persons to create small-scale technology certificates applies under the Renewable Energy (Electricity) Regulations (2001). Capacity band data has not been lag-adjusted. Average system size data has been lag-adjusted. Data is subject to change. Totals may not sum to 100% due to rounding.
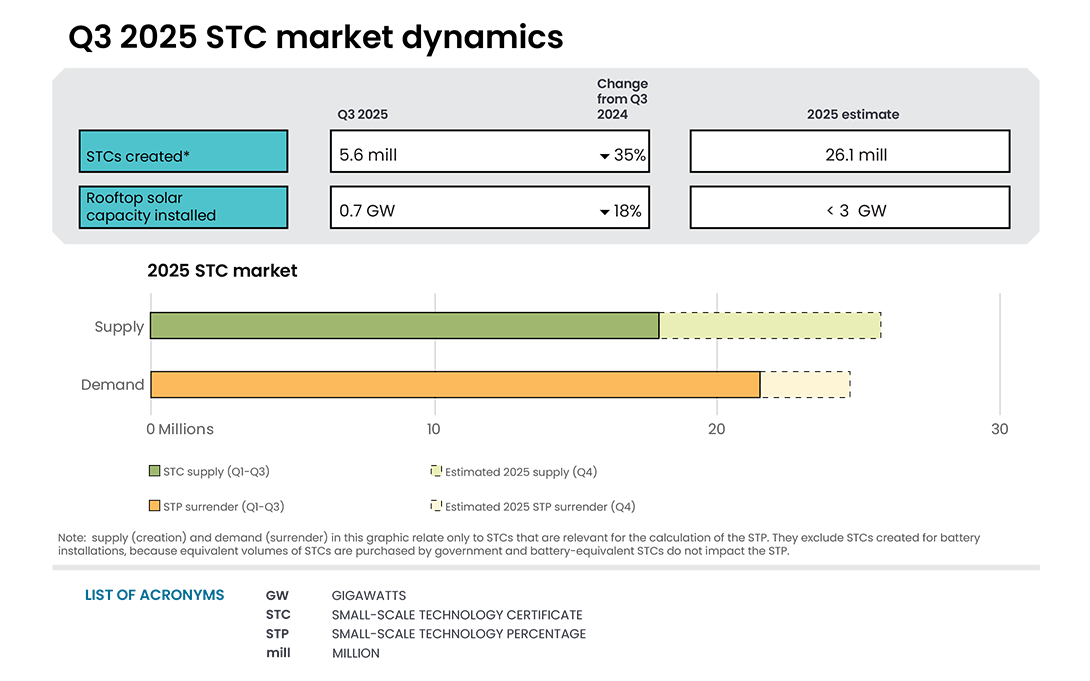
STC market dynamics
STC creations from small-scale solar, wind, and hydro (small-scale generation units), solar water heaters (SWHs), and air source heat pumps (ASHPs) are below the expected creation rate used to calculate the 2025 STP. This reduction in STC creations has primarily been driven by a drop in small-scale solar installations, which is largely attributed to the strong uptake of the Cheaper Home Batteries Program as discussed above.
STC creations in Q3 2025 were 5.6 million, bringing year-to-date creations in 2025 to 18.2 million. These figures exclude STCs created as part of the Cheaper Home Batteries Program which are purchased by government rather than by entities with compliance obligations under the SRES (mostly electricity retailers). The average weekly STC creation rate in Q3 2025 was around 407,000, which is below the average weekly supply of 502,000 required to meet the 2025 STP.
Under the Small-scale Renewable Energy Scheme, an under or oversupply of STCs from small-scale generation units, SWHs, and ASHPs relative to STP requirements is accounted for through the cumulative adjustment mechanism. An undersupply of such STCs in 2025 compared to the estimated number of creations used to set the 2025 STP would simply be reflected through a downward cumulative adjustment in the 2026 STP. As usual, the Minister will set the 2026 STP on or before 31 March 2026.
With reduced STC creations from small-scale solar, liable entities relied on the STC Clearing House to meet their surrender obligations ahead of the Q3 2025 surrender deadline on 28 October 2025. In Q3 2025, 6.3 million STCs were bought from the STC Clearing House, up from 4.8 million in Q3 2024. This excludes those purchased by government under the Cheaper Home Batteries Program. As a result of the lower creations, the STC market price remained close to the STC Clearing House price of $40 throughout Q3 2025. This increased use of the STC Clearing House is expected to continue for the rest of 2025 because the supply of STCs in the open market from small-scale solar installations is lower than projected when the 2025 STP was set, prior to the Cheaper Home Batteries Program.
The STC Clearing House was in deficit at the beginning of Q3 2025 and remained so until late August. The STC Clearing House moved into surplus for most of September due to the rapid STC creations from batteries. Several periods of deficit coinciding with the purchase of STCs from batteries by government were observed in September.
Description
This figure shows the weekly supply of STCs in 2025. It also shows the required weekly supply of STCs (501,923) to meet the 2025 STP.
This figure is interactive. Hover over/tap each segment to see the number of STCs. Hover over/tap along the line to see the number of required STCs. Click/tap on the items in the legend to hide/show data in the figure.
Small print
Required STC supply refers to the estimated number of STCs to be created (24.9 million) to meet the annual STP liability and under/over supply from previous years. Some weeks are spread across multiple months, the month label refers to the month as at the end of the week. The final week may be significantly lower than prior weeks if the quarter ends during the week. For example, Q3 2025 ended on Tuesday 30 September so the final ‘week’ of September contains only 2 days.
Small-scale technology certificate (STC) reported spot and clearing house prices
Note: This figure is not interactive.
Description
This figure shows the daily closing STC spot price over time. It also shows the STC clearing house price.
Small print
Pricing data is complied from trades reported by CORE markets and may not be comprehensive. Prices are shown from 1 December 2020 to 30 September 2025.
Read more about buying and selling STCs, including through the clearing house.
Air source heat pump installations settling from record years
ASHP installations in 2025 are on track to approximately match the number of installations in 2022 (87,000), settling from 2 strong years in 2023 (132,000) and 2024 (111,000). Approximately 24,000 ASHPs were installed in Q3 2025, down 11% compared to the 27,000 installed in Q3 2024. Year-to-date installations in 2025 have reached around 65,000, reflecting a 26% reduction relative to Q1 to Q3 2024.
Description
This figure shows the number of air source heat pump (ASHP) installations under the Small-scale Renewable Energy Scheme (SRES) by state and territory over time. It also shows the number of STCs validated from these installations over time. Totals may not sum due to rounding applied to NT.
This figure is interactive. Hover over/tap over each section to see the number of installations. Hover over/tap along the line to see number of STCs. Click/tap on the items in the legend to hide/show data in the figure.
Small print
Where cell values are less than 10, data have been modified due to privacy considerations. In the figure these values appear as 10.
A 12 month creation period for registered persons to create small-scale technology certificates (STCs) applies under the Renewable Energy (Electricity) Regulations (2001). Data for installations in 2024 to 2025 have been lag-adjusted to account for the 12 month creation rule and are estimates only. STC validation data has been rounded to the nearest thousand. Data is subject to change.
Supplementary figures
Description
This figure shows the rooftop solar capacity installed under the Small-scale Renewable Energy Scheme (SRES) by state and territory over time.
This figure is interactive. Hover over/tap each line to see the capacity. Click/tap on the items in the legend to hide/show data in the figure.
Small print
A 12 month creation period for registered persons to create small-scale technology certificates applies under the Renewable Energy (Electricity) Regulations (2001). Data for installations in 2024 to 2025 have been lag-adjusted to account for the 12 month creation rule and are estimates only. There may be small differences between the sum of lag-adjusted state and territory estimates and the national lag-adjusted estimate. Data is also subject to change and totals may not sum due to rounding.
Description
This figure shows small-scale rooftop solar replacements as a proportion of total installations by state and territory over time.
This figure is interactive. Hover over/tap each line to see the proportion of installations. Click/tap on the items in the legend to hide/show data in the figure.
Small print
Replacements represent small-scale rooftop solar systems categorised in the Renewable Energy Certificate (REC) Registry as replacements. The installation type data field was added to the REC Registry in late 2020, and was made mandatory from 28 January 2021. Data has not been lag-adjusted. Data is subject to change due to the 12 month creation rule.
Description
This figure shows STC supply over time.
This figure is interactive. Hover over/tap each bar to see the number of STCs. Hover over/tap along the line to see the annual total number of STCs.
Description
This figure shows the volume of STCs transacted and the number of transactions, excluding STC clearing house transactions, over time. Data excludes STCs created from batteries.
This figure is interactive. Hover over/tap each bar to see the number of STCs. Hover over/tap along the line to see the number of transactions. Click/tap on the items in the legend to hide/show data in the figure.