
On this page
- Market dynamics
- High volume of approved large-scale capacity
- Strong quarter for final investment decisions
- Voluntary (non-RET) LGC Holdings increase in Q3
- Supplementary figures
Market dynamics
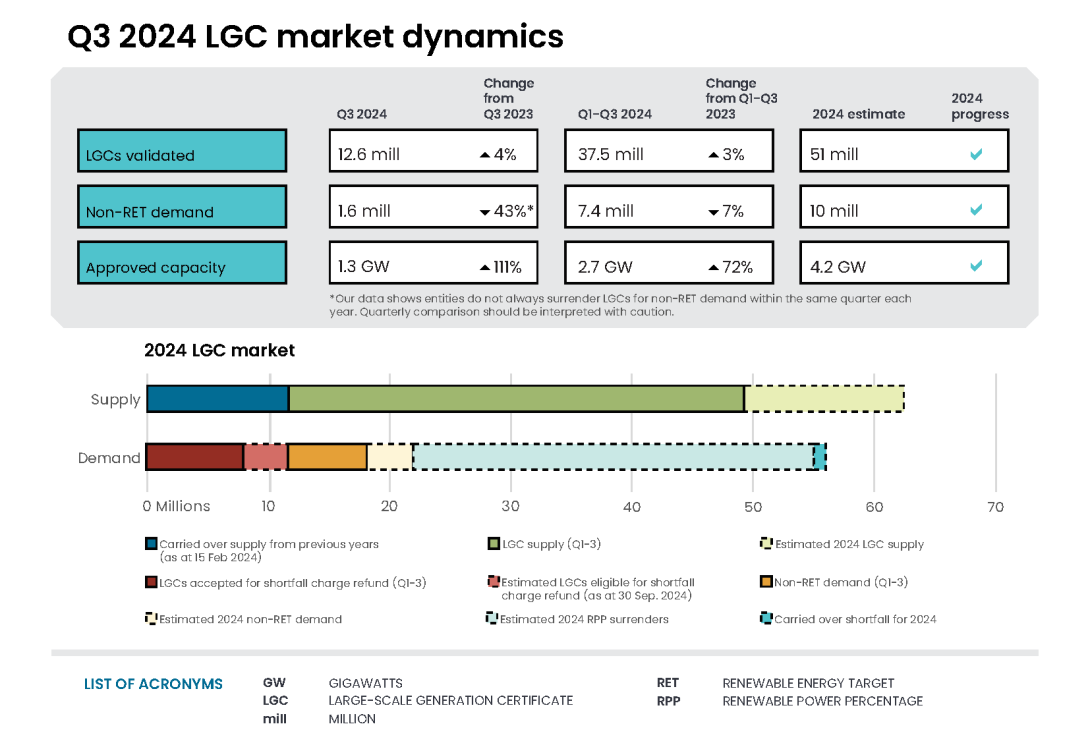
Table 2: LGC supply and demand summary for Q3 2024
| Supply | Demand | |
|---|---|---|
| Carried over supply from previous years (as of 15 Feb 2024) | 11.9m | |
| LGC supply (Q1-3) | +37.5m | |
| Estimated Q4 2024 LGC supply | +13.5m | |
| Non-RET demand (Q1-3) | -7.4m | |
| Estimated Q4 2024 non-RET demand | -2.6m | |
| Estimated 2024 RPP surrenders | -33.0m | |
| LGCs accepted for shortfall charge refund (Q1-3) | -7.4m | |
| Carried over shortfall for 2024 | -0.5m | |
| Estimated balance as of 15 Feb 2025 | 12.0m |
Note: There is a total of 8.6 million LGCs in shortfall that are eligible for shortfall refunds to be claimed.
In Q3 2024, 12.6 million LGCs were validated, bringing total LGC validations to 37.5 million for the year.
Description
This figure shows the number of LGCs validated by technology type over time.
This figure is interactive. Hover over/tap each segment to see the number of LGCs. Click/tap on the items in the legend to hide/show data in the figure.
Small print
Waste coal mine gas is no longer eligible to create LGCs as of 2021. Validations in 2021 reflect LGCs that were created prior to 2021.
The LGC spot price continued to soften over Q3 2024 from $45.50 to $41.50. The spot price averaged $44.89 in Q3 2024 and future LGC prices for calendar years 2024 to 2027 also fell over Q3 2024. The spot price fell materially after the end of the quarter to $27 as of 14 November.
Market intelligence has suggested that:
- Purchases for voluntary surrenders being concentrated at the start of the year, resulting in reduced demand in the market in the second half
- Project operators prioritising allocations of generated LGCs for contractual obligations at the start of the year, freeing up LGCs created later in the year to enter the spot market.
Large-scale generation certificate (LGC) reported spot and forward prices
Note: This figure is not interactive.
Description
This figure shows the daily closing LGC spot price and calendar year forward prices over time.
Small print
For example, Cal25 is the 2025 calendar year, where an agreement is made to buy/sell LGCs at a specified price in 2025. Pricing data is compiled from trades reported by CORE markets and may not be comprehensive.
High volume of approved large-scale capacity
Approved capacity in Q3 2024 under the Large-scale Renewable Energy Target (LRET) was very high. 1.3 GW of capacity was approved during this period. This was driven by several large power stations being approved, including:
- Golden Plains Wind Farm in Victoria (756 MW)
- Cunderdin Hybrid Solar and Battery facility (128 MW)
- North Star Junction Solar facility in Western Australia (117 MW).
This outcome, alongside the accreditation of Macintyre wind farm (923 MW) has taken total accredited to 3.6 GW by mid-November 2024. An additional 0.7 GWs is expected to be accredited in Q4 taking the total above 4.2 GW and exceeding the record 4.19 GW set in 2020.
Description
This figure shows the capacity of large-scale wind and solar power stations approved by the Clean Energy Regulator to generate large-scale generation certificates over time.
This figure is interactive. Hover over/tap each bar to see the capacity. Click/tap on the items in the legend to hide/show data in the figure.
Small print
Solar and wind hybrid projects are grouped under the solar category. Totals may not sum due to rounding.
For the first time since 2020, wind power is on track to make up the bulk of approved power stations in a calendar year. At the end of Q3 2024, wind power made up 62% of the 2.7 GW approved. This proportion increased with the approval of MacIntyre wind farm in October, adding another 923 MW to the total.
Strong quarter for final investment decisions
In Q3 2024, 1.2 GW of capacity reached a final investment decision. This included:
- Broadsound Solar Farm (376 MW)
- Lotus Creek Wind Farm (285 MW)
- Goorambat East Solar Farm (250 MW)
- Boulder Creek Wind Farm (228 MW).
3.0 GW of capacity has reached a final investment decision to date in 2024. This has nearly doubled the total capacity that reached final investment decision in 2023 (1.7 GW).
Description
This figure shows the capacity and four quarter rolling average of large-scale renewable power stations to reach a final investment decision over time.
This figure is interactive. Hover over/tap each bar to see the capacity. Hover over/tap along the line to see the rolling average. Click/tap on the items in the legend to hide/show data in the figure.
Small print
The Clean Energy Regulator tracks public announcements. Data may be incomplete and may change retrospectively. Totals may not sum due to rounding.
Data as at 30 June 2024.
Stage A of the Capacity Investment Scheme (CIS) Tender 1 - NEM Generation closed on 1 July 2024. Stage B of CIS Tender 1, in which shortlisted projects were invited to submit financial value bids, closed on 26 September 2024. Successful bids are expected to be announced around the end of 2024.
Stage A of the CIS Tender 2 – Wholesale Electricity Market (WEM) Dispatchable Capacity closed on 19 August 2024. Stage B of CIS Tender 2 will occur from October to November 2024, with successful bids expected to be announced in March 2025.
Voluntary (non-RET) LGC Holdings increase in Q3
LGC holdings increased by 6.8 million to 35.3 million at the end of Q3 2024. Holdings by voluntary participants increased to a record 6.9 million from 6.1 million in Q2.
Description
This figure shows LGC holdings in Renewable Energy Certificate (REC) Registry accounts by market participation category over time.
This figure is interactive. Hover over/tap each data point to see the number of LGCs in millions. Click/tap on the items in the legend to hide/show data in the figure.
Small print
Holdings are for registered LGCs as at the end of the quarter and exclude any pending transactions. Accounts are categorised according to their primary role or function based on transaction patterns and the name of the account. An account's category is subject to change.
Category definitions
Liable entity
Account holder is a liable entity.
Power station
Account holder has created LGCs.
Non-RET (voluntary)
Account holder has surrendered LGCs voluntarily. This includes accounts labelled as 'GreenPower' in the REC registry.
Non-RET (compliance)
Account holder has surrendered LGCs voluntarily for non-RET compliance reasons (for example, desalination plants) or the account holder is a Safeguard entity or related to a Safeguard entity.
Non-RET (government)
Account holder has surrendered LGCs voluntarily and is a government entity.
Intermediary
Account holder has transacted/received over 1 million LGCs and does not fit into any of the other categories.
Other
Account holder does not fit into any of the other categories.
Non-RET surrenders totalled 1.6 million LGCs in Q3 2024. Within this volume, 8 entities surrendered a combined 0.11 million LGCs for the first time in Q3 2024.
Description
This figure shows non-RET LGC cancellations by demand source over time.
This figure is interactive. Hover over/tap each segment to see the number of LGCs. Click/tap on the items in the legend to hide/show data in the figure.
Small print
This classification system is uniform across Australian carbon credit unit (ACCU) and LGC cancellations.
Covered activities for each classification
Voluntary demand
Cancellations made against voluntary certification programs such as Climate Active and any sort of organisational emissions or energy targets.
Government demand
Cancellations by or on behalf of government entities. For example, to offset emissions from vehicle fleets or meet voluntary emissions reduction targets.
Compliance demand
Cancellations made by private organisations and corporations for compliance or obligations against municipal, local, state and territory government laws, approvals, or contracts. For example to meet Environmental Protection Authority requirements.
Supplementary figures
Large-scale generation certificate (LGC) spot price
Note: This figure is not interactive.
Description
This figure shows the daily closing LGC spot price over time.
Small print
Spot price data is compiled from trades reported by CORE markets and may not be comprehensive. Includes price data up to and inclusive of 15 November 2024.