
On this page
- Market dynamics
- Rooftop solar installations remain high
- Battery-connected systems may increase in Q4
- Rooftop solar added from replacing older systems
- Supplementary figures
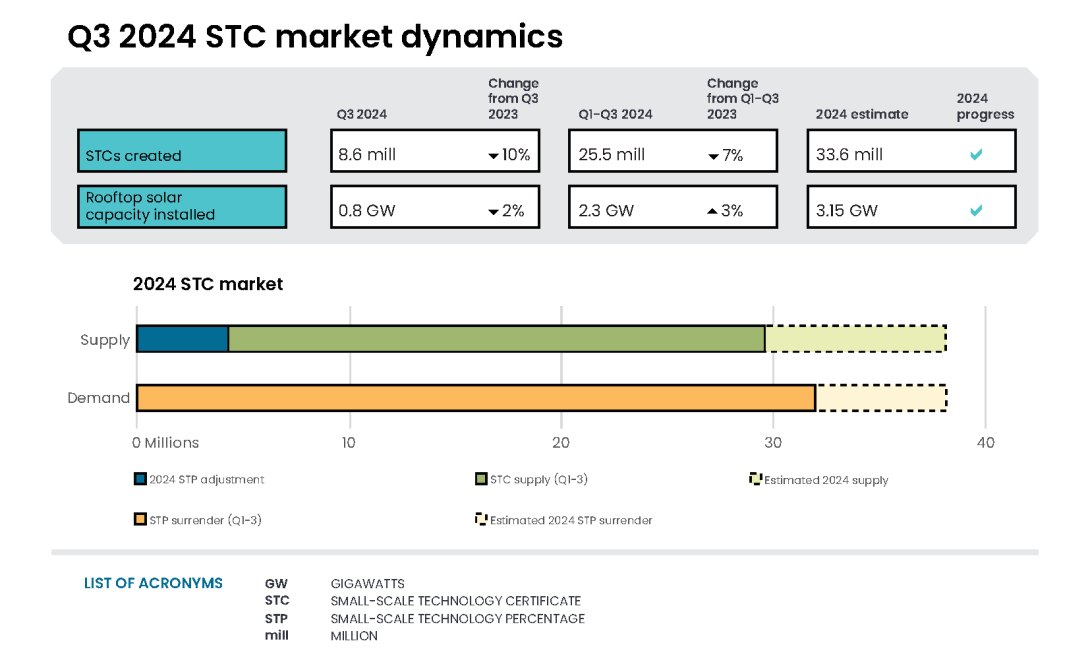
Market dynamics
In Q3 2024, 8.6 million STCs were created. Of which:
- 7.8 million STCs were from rooftop solar installations
- 0.9 million STCs were from solar water heater and air source heat pump installations.
STC creations are on-track to meet the required weekly supply for STP liability.
Description
This figure shows the weekly supply of STCs in 2024. It also shows the required weekly supply of STCs (646,154) to meet the 2024 STP.
This figure is interactive. Hover over/tap each bar to see the number of STCs. Hover over/tap along the line to see the required weekly supply. Click/tap on the items in the legend to hide/show data in the figure.
Small print
Required STC supply refers to the estimated number of STCs to be created (33.6 million) to meet the annual STP liability and under/over supply from previous years. Some weeks are spread across multiple months, the month label refers to the month as at the end of the week. Data as at 30 September 2024.
The surrender deadline for the Q3 2024 compliance period was 28 October 2024. A total of 9.5 million STCs were surrendered at a compliance rate of 100%. To date, 32.1 million STCs of the 37.9 million annual compliance requirements have been surrendered. The total amount to be surrendered includes the estimated number of STCs to be created, plus the cumulative adjustment.
Small-scale technology certificate (STC) reported spot and clearing house prices
Note: This figure is not interactive.
Description
This figure shows the daily closing STC spot price over time. It also shows the STC clearing house price.
Small print
Pricing data is compiled from trades reported by CORE markets and may not be comprehensive.
Read more about buying and selling STCs, including through the clearing house.
The STC spot price remained at $39.90 for the majority of Q3 2024. This was due to the Clearing House remaining in deficit for most of the quarter. It closed out the quarter in a small surplus of 0.15 million STCs before sliding back into deficit as market supply tightened in the lead up to the Q3 2024 surrender deadline.
Rooftop solar installations remain high
In Q3 2024, 81,000 rooftop solar systems were installed with a total capacity of 0.80 GW. This is on par with the 0.82 GW installed in Q3 2023.
In Q3 2024, the average system size installed was 9.9 kilowatts (kW), compared to 9.4 kW in Q3 2023. This continues the trend of increasing average system sizes through each calendar year.
Description
This figure shows the installed capacity and the number of small-scale rooftop solar installations over time.
This figure is interactive. Hover over/tap each bar to see the installed capacity. Hover over/tap along the line to see the number of installations. Click/tap on the items in the legend to hide/show data in the figure.
Small print
Small-scale rooftop solar systems must have a capacity of less than 100 kilowatts (kW). A 12 month creation period for registered persons to create small-scale technology certificates applies under the Renewable Energy (Electricity) Regulations (2001). Data for installations and installed capacity in 2023 and 2024 have been lag-adjusted to account for the 12 month creation rule and are estimates only. Data is subject to change.
Battery-connected systems may increase in Q4
Voluntary battery data reported to the Clean Energy Regulator (CER) indicates that 9% of rooftop solar installations were battery-connected in Q3 2024. Data for NSW suggests a modest drop in the proportion of battery-connected rooftop solar installations compared with the rest of Australia over Q3 2024 following the announcement in May 2024 that eligibility for the state’s battery incentive scheme would commence in November 2024. With the commencement of this scheme NSW installs may increase from the middle of Q4 2024.
Description
This figure shows the proportion of battery-connected small-scale rooftop installation in New South Wales and the rest of Australia in 2024.
This figure is interactive. Hover over/tap along the line to see the proportion of battery-connected small-scale rooftop installations. Click/tap on the items in the legend to hide/show data in the figure.
Small print
Small-scale rooftop solar systems must have a capacity of less than 100 kilowatts (kW). A 12 month creation period for registered persons to create small-scale technology certificates applies under the Renewable Energy (Electricity) Regulations (2001). Data as at 30 September 2024 and has not been lag-adjusted to account for the 12 month creation rule. Data is subject to change.
Battery installations are reported on a voluntary basis as part of Small-scale Renewable Energy Scheme system registration, and may not be representative or complete.
Rooftop solar added from replacing older systems
Detailed data on replacement PV system has been collected by the CER since 2021. Replacements are a growing component of the solar PV market. In 2024, 18% of installations are reported as a replacement, up from 14% in the same period last year.
On average, replacement systems in 2024 are replacing earlier installations with a capacity of 3.6 kW. For 2024 each replacement system is adding 5.4 kW of net capacity. That is, the actual average size replacement system was 9 kW.
Description
This figure shows the average system sizes of small-scale rooftop solar replacement systems and matched original systems in kilowatts (kW), plus the number of replacement systems.
This figure is interactive. Hover over/tap each segment to see the number of systems. Hover over/tap along the line to see the number of replacements. Click/tap on the items in the legend to hide/show data in the figure.
Small print
Small-scale rooftop solar systems must have a capacity of less than 100 kilowatts (kW). A 12 month creation period for registered persons to create small-scale technology certificates applies under the Renewable Energy (Electricity) Regulations (2001). Data as at 30 September 2024 and has not been lag-adjusted to account for the 12 month creation rule. Data is subject to change.
This estimate is based on preliminary analysis of reported replacement systems in the REC Registry from Q1 2021 to Q3 2024. It relies on the ability to match the reported replacement with a previous installation at the same address and only considers unique addresses where two solar PV installations have occurred. Analysis of replacement rates is an ongoing piece of work for the CER. Data matching capabilities are progressively being improved to tackle legacy data for rooftop systems dating back more than 15 years, analysis will be updated as methods improve.
Methodology note: This estimate is based on preliminary analysis of reported replacement systems in the REC Registry from Q1 2021 to Q3 2024. It relies on the ability to match the reported replacement with a previous installation at the same address. Analysis of replacement rates is an ongoing piece of work for the CER. Data matching capabilities are progressively being improved to tackle legacy data for rooftop systems dating back more than 15 years, analysis will be updated as methods improve.
Supplementary figures
Description
This figure shows the number of air source heat pump installations under the Small-scale Renewable Energy Scheme (SRES) by state and territory over time. It also shows the number of STCs validated from these installations over time.
This figure is interactive. Hover over/tap each segment to see the number of installations. Hover over/tap along the line to see the number of STC validations. Click/tap on the items in the legend to hide/show data in the figure.
Small print
Where cell values are less than 10 data have been modified due to privacy considerations. In the figure these values appear as 10.
A 12 month creation period for registered persons to create small-scale technology certificates (STCs) applies under the Renewable Energy (Electricity) Regulations (2001). STC validation data has been rounded to the nearest thousand. Data as at 30 September 2024 and has not been lag-adjusted. Data is subject to change.
Description
This figure shows the rooftop solar capacity installed under the Small-scale Renewable Energy Scheme (SRES) by state and territory over time.
This figure is interactive. Hover over/tap along the lines to see the capacity. Click/tap on the items in the legend to hide/show data in the figure.
Small print
A 12 month creation period for registered persons to create small-scale technology certificates applies under the Renewable Energy (Electricity) Regulations (2001). Data for installations in 2023 and 2024 have been lag-adjusted to account for the 12 month creation rule and are estimates only. Data is subject to change.
Description
This figure shows the proportion of rooftop solar systems installed under the Small-scale Renewable Energy Scheme (SRES) by capacity band over time.
This figure is interactive. Hover over/tap each segment to see the proportion. Click/tap on the items in the legend to hide/show data in the figure.
Small print
A 12 month creation period for registered persons to create small-scale technology certificates applies under the Renewable Energy (Electricity) Regulations (2001). Data as at 30 September 2024 and has not been lag-adjusted. Data is subject to change. Totals may not sum to 100% due to rounding.
Description
This figure shows small-scale rooftop solar replacements as a proportion of total installations by state and territory over time.
This figure is interactive. Hover over/tap along the line to see the proportion of replacement installations. Click/tap on the items in the legend to hide/show data in the figure.
Small print
Replacements represent small-scale rooftop solar systems categorised in the Renewable Energy Certificate (REC) Registry as replacements. The installation type data field was added to the REC Registry in late 2020. Data as at 30 September 2024 and has not been lag-adjusted. Data is subject to change due to the 12 month creation rule.
Description
This figure shows the small-scale rooftop solar average system size over time.
This figure is interactive. Click/tap along the line to see the average system size.
Small print
Small-scale rooftop solar systems must have a capacity of less than 100 kW. A 12 month creation period for registered persons to create small-scale technology certificates applies under the Renewable Energy (Electricity) Regulations (2001). Data for average system size in 2023 and 2024 have been lag-adjusted to account for the 12 month creation rule and are estimates only. Data is subject to change.
Description
This figure shows the volume of STCs transacted and the number of transactions, excluding STC clearing house transactions, over time.
This figure is interactive. Hover over/tap each bar to see the number of STCs. Hover over/tap along the line to see the number of transactions. Click/tap on the items in the legend to hide/show data in the figure.
Description
This figure shows STC supply over time.
This figure is interactive. Hover over/tap each bar to see the number of STCs.