What’s on this page?
Highlights
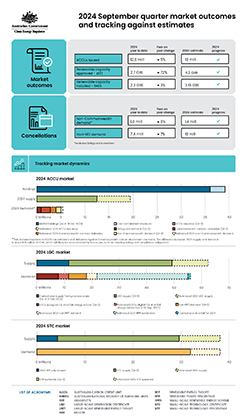
- All Safeguard facilities emissions data has been reported and Safeguard entities now know whether they have exceeded their baselines.
- An increase in trading activity driven by Safeguard entities has seen a rise in ACCU prices. ACCU prices have increased by more than 19 per cent since the start of Q3 2024, to now sit at $42.50 on 19 November 2024.
- There were 45 million ACCUs in accounts at the end of Q3, with 27.5 million (61%) being held by Safeguard entities.
- ACCU supply for the calendar year is in the order of 19 million. While this is slightly lower than the initial estimate of 20 million, it will surpass the record of 17.7 million set in 2022.
- Total renewable installed capacity is now expected to be 7.2 to 7.5 GW in 2024 and exceed the 2020 record of 7.16 GW.
- At the end of October 2024, 3.6 GW had been approved with confidence that another 0.7 GW will be likely approved before the end of 2024.
- Small-scale rooftop solar capacity is expected to reach 3.15 GW. This is a strong result that is close to the 3.19 GW record set during the COVID-19 home improvement boom.
- Australia’s largest wind farm, MacIntyre wind farm at 923 MW was approved following the end of the quarter, in October 2024.
- The LGC spot price has fallen materially from $45.50 at the start of Q3 to $27.25 on 19 November 2024. The sell off gained momentum as the price falls led to some needing to cover their position and exposure by selling as the market dropped. The market remains relatively tight for the 2024 compliance year.
- Due to low wind and hydro generation in Q2 and extending into Q3 we now expect LGC creations in 2024 to be about 51 million. This will be a record year, surpassing the 49 million created in 2023.
- At the end of Q3 2024, 7.4 million LGCs had been cancelled for non-RET demand and remains on track to reach 10 million by the end of 2024.
- Accumulation of LGCs in non-RET (voluntary) accounts has continued. Holdings in these accounts rose 0.8 million to 6.9 million throughout Q3 2024. This accumulation activity supports the expectation of even stronger non-RET demand in 2025 as entities look to meet 100 per cent renewable commitments.
- New analysis shows that replacement rooftop PV systems are adding to the overall rooftop capacity, with systems in 2024 being on average 5.4 kW larger than those they are replacing.
Click on the image below to download a full-sized version.

Data workbook
The QCMR data workbook – September Quarter 2024 contains the data underlying the figures in the report as well as additional data.
Updated: 28 November 2024
Changes
New graphs:
- Figure 1.4 - Australian carbon credit unit (ACCU) transactions and volumes transacted
- Figure 3.4 - Proportion of battery-connected small-scale rooftop installations in New South Wales and the rest of Australia in 2024
- Figure 3.5 - Average system sizes of small-scale rooftop solar replacement systems and matched original systems in kilowatts (kW)
Removed graph:
- Figure 2.8 - Final investment decision (FID) capacity in gigawatts (GW) and potential revenue per megawatt hour (MWh) for utility solar and wind
Media release
Read the media release: 2024 shapes as a record-breaking year for renewable energy deployment