Key messages
- Final investment decisions (FID) for new investment remain low, with 170 megawatts (MW) announced in Q3 2023.
- In Q3 2023, 95% of the 608 MW renewable power station capacity approved for LGC creation was wind.
- We expect to approve about 2.5 GW in 2023.
- In Q3 2023, 2.7 million LGCs were voluntarily cancelled.
- The LGC voluntary cancellations estimate for 2023 has been upgraded to 9.5 million.
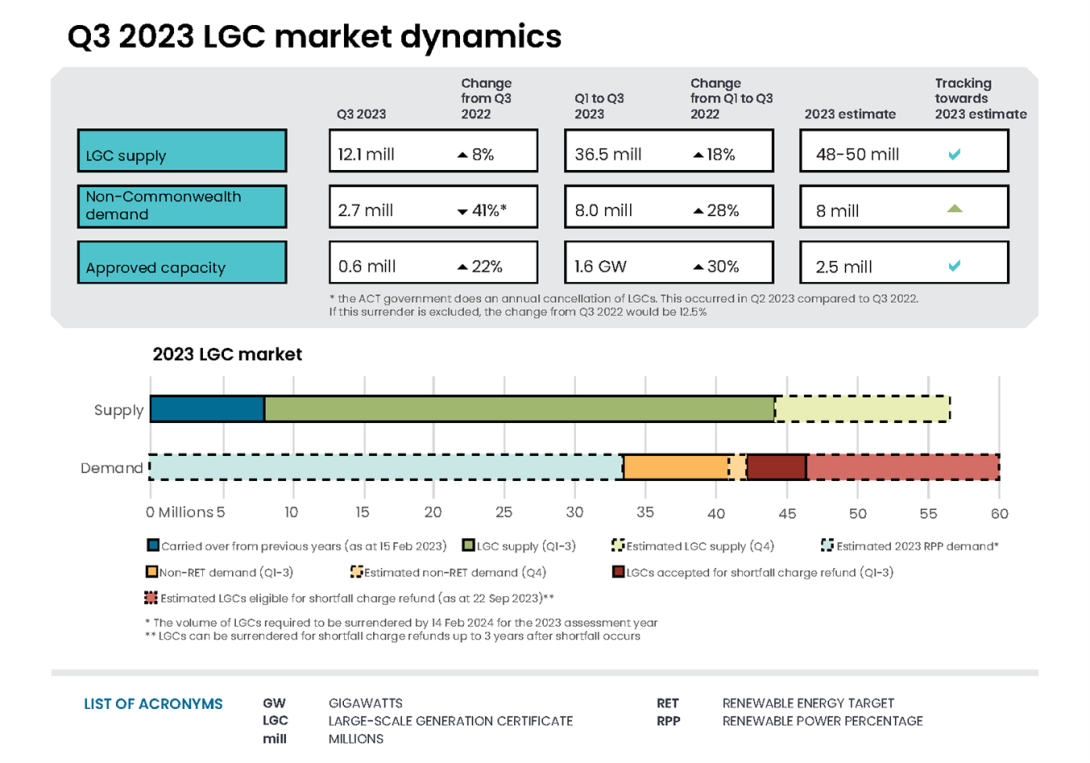
- Both LGC supply and demand in 2023 will be at a similar level of about 48 to 50 million, with an effective deficit of about 14.4 million in the market.
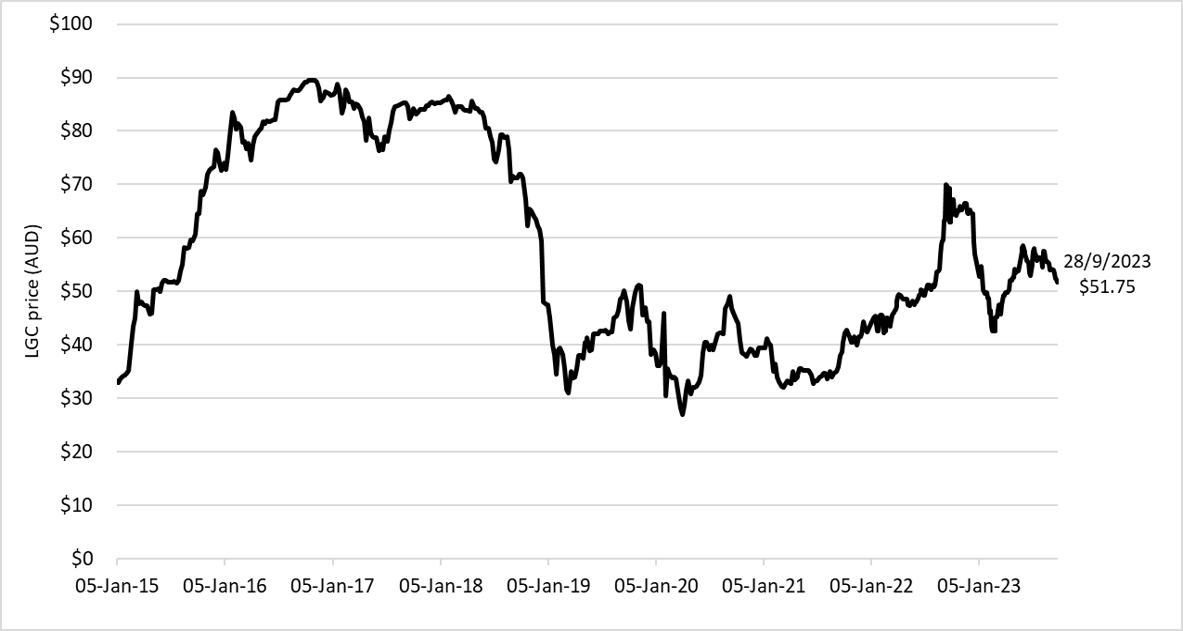
- The reported spot LGC price peaked in early July at $58.00 and then fell steadily to $51.75 by the end of Q3 2023. The price drifted lower to $46.50 in early November 2023.
Market dynamics
The LGC spot price peaked at $58.00 on 10 July 2023. The price then fell steadily to $51.75 by the end of Q3 2023 and continued drifting lower to about $46.50 at the start of November 2023.
As discussed in the Q4 2022 QCMR, there is an effective deficit of LGCs. This deficit is a result of liable entities electing to not meet their Large-scale Renewable Energy Target (LRET) obligations and instead taking shortfall. If the shortfall is less than 10% of the liable entity’s obligation, it can be carried over to the next year. However, if the shortfall is greater than 10%, a shortfall charge must be paid. This charge is refunded if conditions are met, including surrendering the required LGCs within 3 years. This has been working as a liquidity mechanism for the market.
Large-scale generation certificate (LGC) spot price
January 2015 to September 2023 Note: This figure is not interactive.
Description
This figure shows the LGC spot price from January 2015 to September 2023.
Small print
Pricing data is compiled from trades reported by CORE markets, and may not be comprehensive.
In Q3 2023, LGC supply was 12.1 million, an 18% increase compared to Q3 2022. This reflects higher levels of renewable generation. In the first 3 quarters of 2023, LGC supply was 36.5 million. We still expect to issue 48 to 50 million LGCs in 2023.
The 3 competing demands for LGCs keeping the market tight are:
- 2023 renewable power percentage (RPP) - Liable entities (generally electricity retailers) are required to surrender 33 million LGCs in 2023. Some liable entities may opt to take shortfall.
- Voluntary - We expect about 9.5 million LGCs to be voluntarily cancelled in 2023.
- Shortfall - At the end of Q3 2023, around 14 million LGCs were eligible for refund over the next 3 years. More than 4 million have been surrendered for refund as at November 2023.
Hence, both LGC supply and demand in 2023 will be at a similar level of about 48 to 50 million. An effective total market deficit of about 14.4 million LGCs remains, which includes the 10% carry forward of about 0.5 million LGCs. LGC supply and demand looks to remain tight for at least the next few years.
The expanded Capacity Investment Scheme (CIS) was announced post quarter (discussed further below). The CIS is additional to the RET. Projects incentivised under the CIS will be able to create LGCs for renewable generation up to the end of 2030. Final RET liability acquittal will occur on 14 February 2031. Under the RET legislation, only LGCs can be used to meet RET liability and to redeem shortfall charges. Shortfall charges can be redeemed after the last liability date until all LGCs have been surrendered.
The expanded CIS is expected to increase future LGC supply, noting there is a lag of several years for new projects to be built and start generating electricity. Non-RET demand continues to increase (discussed below). In addition, the proposed mandatory climate-related financial disclosures could be another driver of non-RET demand in the future. This disclosures policy could unlock over 100 TWh or 100 million LGCs of annual voluntary demand. This would be from the above publication threshold NGER reporters if they all choose to use market-based accounting to report net zero for scope 2 emissions.
The Renewable Energy Guarantee of Origin (REGO) certificate approach paper consultation closed on 24 October 2023. The paper proposed a framework for the creation of renewable energy certificates, like that under the RET, that will exist after 2030.
At the end of Q3 2023, there were 33 million LGC holdings in the Renewable Energy Certificate (REC) registry. This is 18% more than the 28 million at the end of Q3 2022.
Insights
- FID remains low, new PPAs announced
- Steady pipeline of power station approvals for LGC creation
- Renewable penetration in the National Electricity Market (NEM) continues to rise
- Strong growth in voluntary demand continues
FID remains low, new PPAs announced
We saw another small quarter for new wind and solar power station investment commitments. Four projects, totalling 170 megawatts (MW), reached a final investment decision (FID) in Q3 2023. Total FID at the end of Q3 2023 was 696 MW.
In Q2 2023, we downgraded our FID estimate to 2.5 gigawatts (GW). Our latest discussions with project developers suggest FID dates may shift to 2024, depending on the timing of commercial decisions. Hence, it isn’t practicable to make a revised estimate for the remainder of 2023.
Description
This figure shows the capacity and four quarter rolling average of large-scale renewable energy to reach FID each quarter from 2016 to 2023.
This figure is interactive. Hover over/tap each bar to see the capacity in megawatts (MW). Hover over/tap along the line to see the rolling average of the previous four quarters. Click/tap on the items in the legend to hide/show data in the figure.
Small print
The Clean Energy Regulator (CER) tracks public announcements. The above information may not be complete and may change retrospectively.
Data as at 30 September 2023.
In the Q2 2023 QCMR we discussed the many barriers to achieving FID, which remain. One of these barriers was a lack of power purchase agreements (PPAs). PPAs are a lead indicator of potential future FID announcements. In September and October 2023, we saw several PPAs announced, including:
- Bulli Creek solar farm (25 year PPA with Fortescue for 337.5 MW of the proposed 450 MW first stage)
- Munna Creek solar farm (PPA with Telstra for 60 MW of the 120 MW)
- Macarthur wind farm (6 year PPA with National Broadband Network (NBN) for 42 MW of the 420 MW).
Another barrier previously discussed is workforce shortages. The Australian Government commissioned Jobs and Skills Australia to develop the Clean Energy Generation: workforce needs for a net zero economy report. The report includes 50 recommendations to ensure Australia has the skills and workforce required to meet its clean energy ambitions.
We have seen a growing demand for new solar and wind generation projects from government owned enterprises. For example, CleanCo put out an expression of interest to add another 3 GW to their portfolio.
The Clean Energy Finance Corporation (CEFC) also announced its first investment via the Rewiring the Nation Fund. The investment commits $100 million to support the NSW electricity infrastructure roadmap.
The CIS established in December 2022 has been expanded to 32 GW nationally, as announced on 23 November 2023. This includes 9 GW of dispatchable capacity and 23 GW for renewables. Around half of the capacity offered under the expanded CIS will occur through bilateral partnerships with the states. New dispatchable projects (or those committed after December 2022) and new renewable energy projects (or those committed after 23 November 2023) will be eligible under the national CIS. The first auction will be held in April 2024. So far:
- The CIS is targeting 600 MW of dispatchable renewable capacity across South Australia and Victoria. The tender was announced on 30 August 2023.
- The Commonwealth and NSW will jointly deliver 1,075 MW of new dispatchable capacity from 3 battery projects and 3 virtual power plants, as announced on 22 November 2023.
These announcements will likely impact future FID, which may increase materially in 2024.
Steady pipeline of power station approvals for LGC creation
In Q3 2023, we approved 608 MW of newly completed capacity for renewable power stations. In the first 3 quarters of 2023, 1.6 GW has been approved. We still expect to approve about 2.5 GW in 2023. Approval means these power stations are eligible to create LGCs for the net energy they export to the grid. Approval coincides with the first generation of renewable energy from these power stations. Achieving approval is a big milestone that can occur several years from when the renewable power station achieved FID.
577 MW (95%) of the approved 608 MW in Q3 2023 was wind. A secure and stable grid requires the right mix of generation types. Wind has the potential to balance solar generation, as it can generate overnight and on cloudy and rainy days.
We could see an increase in new capacity approved in the following years as the 4.5 GW that reached FID in 2022 starts to be constructed.
Renewable penetration in the National Electricity Market (NEM) continues to rise
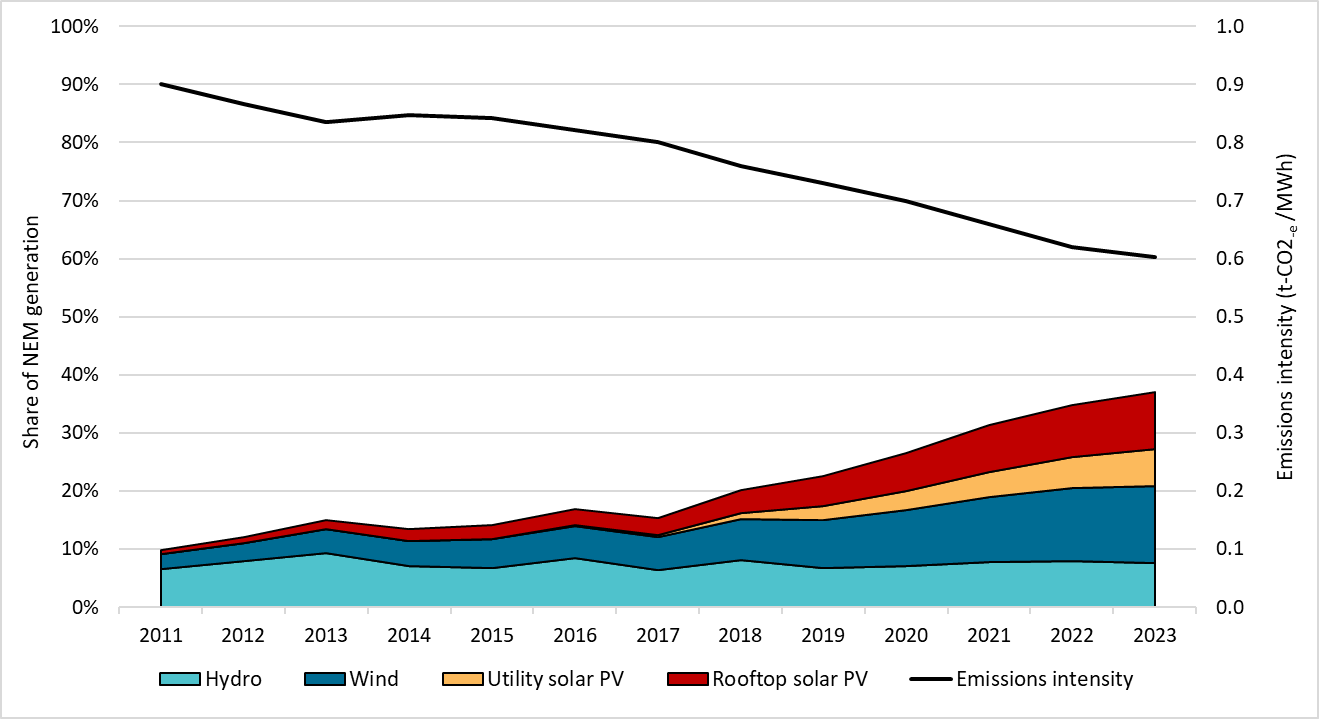
In Q3 2023, renewable energy generation in the NEM increased to 39% of total electricity generation, compared to 34% in Q3 2022. On average, the NEM renewable generation share was split between solar (16%), wind (14%) and hydro (9%). We are on track to reach an average of 40% for 2023.
Since 2018, renewable energy share in the NEM has been increasing at around 4 percentage points per year. As Australia moves into longer daylight hours, we expect to see greater generation from the growing solar capacity of both large-scale power stations and rooftop solar.
Renewables generation share in the National Electricity Market (NEM)
2011 to 2023 Note: This figure is not interactive.
Description
This figure shows the share of generation contributed by renewables and the emissions intensity of the NEM. The NEM operates in NSW, ACT, Queensland, SA, Victoria and Tasmania. It does not include WA or NT.
Small print
Generation and emissions intensity data sourced from OpenNEM on 6 October 2023. A small portion of renewable generation, including biomass, is not shown.
Increasing renewable generation is changing Australia’s energy generation and demand patterns. Solar generation occurs when the sun is shining, typically peaking in the middle of the day. For example, in South Australia, it is no longer uncommon for 100% of demand to be met by renewables for intervals during the day.
Historically, when there was low renewable generation, energy prices were typically lowest overnight. Energy prices are now lowest during the middle of the day owing to high generation from solar relative to demand.
Increasing renewable generation displaces thermal generation and puts downward pressure on the wholesale price. The Australian Energy Market Operator (AEMO) Quarterly Energy Dynamics (QED) report for Q3 2023 shows the average wholesale energy price reduced by two thirds compared to Q3 2022. High renewable generation is also contributing to more negative pricing events. In Q3 2023, there were twice as many zero or negative wholesale price events compared to Q3 2022. Negative prices were often being set by renewable generators during daylight hours. The report noted these renewable generators may be offsetting the negative price with the value from LGCs. Renewable generators may also offset with PPAs.
These patterns will continue to evolve owing to more renewable power stations, increasing storage and upgraded transmission. Currently, large-scale renewable generation (particularly solar) is being curtailed when rooftop solar generation is high. This is to ensure grid stability and balance generation with demand. Batteries can store excess generation and discharge the energy when needed. Installing more batteries will support the grid and could result in less curtailment of large-scale renewable generation capacity.
Strong growth in voluntary demand continues
In Q3 2023, 2.7 million LGCs were cancelled for non-Renewable Energy Target (RET) voluntary demand. In the first 3 quarters of 2023, 8 million LGCs have been voluntarily cancelled – matching our expectations for 2023 and cancelling 0.6 million more than the total cancelled in 2022. Hence, we are upgrading our estimate to 9.5 million voluntary cancellations for 2023. This represents an additional 29% (9,500 gigawatt hours (GWh)) on top of the 33,000 GWh Large Renewable Energy Target (LRET).
The ACT Government does an annual LGC cancellation of around 2 million certificates. This occurred in Q2 2023 compared to Q3 2022, making quarter-to-quarter comparisons challenging. Excluding this surrender, non-RET LGC demand increased by 12.5% in Q3 2023 compared to Q3 2022.
Description
This figure shows LGC cancellations by demand source over time. Annual demand from corporates and local, state and territory governments has been increasing.
This figure is interactive. Hover over/tap each segment to see the number of cancellations. Click/tap on the items in the legend to hide/show data in the figure.
Small print
| Classification | Covered activities |
|---|---|
| Voluntary demand | Cancellations made against voluntary certification programs such as Climate Active, and any sort of organisational emissions or energy targets. |
| Local, state and territory government demand | Cancellations on behalf of local, state and territory governments, for example to offset emissions from state fleets or meet emissions reduction targets. |
| Compliance demand | Cancellations by private organisations and corporations for compliance or obligations against municipal, local, state and territory government laws, approvals, or contracts. For example, to meet Environmental Protection Authority requirements. |
| Other demand | All activity not covered in the previous categories, primarily due to a lack of information available. |
This classification system is uniform across Australian carbon credit unit (ACCU) and LGC cancellations.
Non-RET demand is increasing rapidly, with annual cancellations growing by over 80% per year since 2019. A wide range of entities cancel LGCs to prove their use of renewable energy. We expect this upward trend to continue to be driven by changing policy and voluntary program participation. This includes:
- Proposed mandatory climate-related financial disclosures
- Climate Active participation, which certifies organisations as carbon neutral where they meet the Climate Active Carbon Neutral Standard
- The Climate Active program direction consultation 2023 closes on 15 December 2023. Proposal 5 is to mandate a minimum percentage of renewable electricity use, which could be proven with LGCs.
- Greenpower participation
- Optional reporting of market-based scope 2 emissions for the National Greenhouse and Energy Reporting (NGER) scheme. This is one of the changes commencing for 2023-24 reporting.
- Corporate Emission Reduction Transparency (CERT) report participation. The CERT report is a voluntary initiative for eligible companies to show how they are progressing on their emissions and renewable electricity commitments.
- Corporate emission reduction targets
- Increased pressure from stakeholders for transparency around corporate emissions.
Supplementary figures
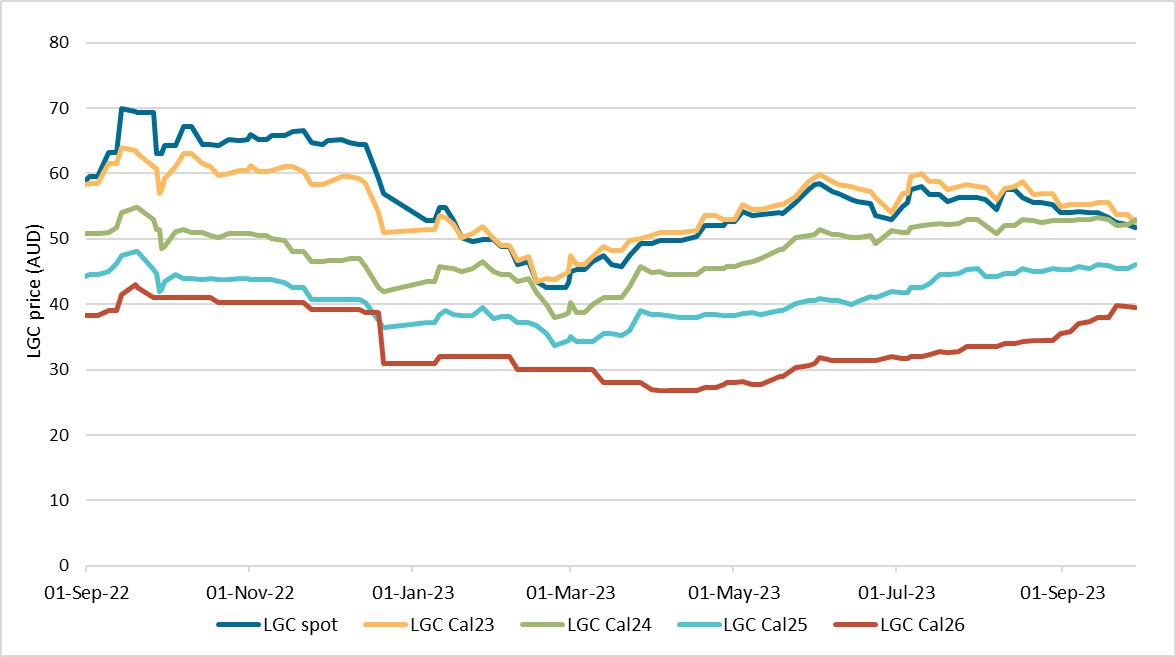
Large-scale generation certificate (LGC) reported spot and forward prices
September 2022 to September 2023 Note: This figure is not interactive.
Description
This figure shows the LGC spot and forward prices over the last 12 months.
Small print
Pricing data is compiled from trades reported by CORE markets, and may not be comprehensive.
Description
This figure shows the number of LGCs validated by technology type over time.
This figure is interactive. Hover over/tap each segment to see the number of LGCs. Click/tap on the items in the legend to hide/show data in the figure.
Small print
Waste coal mine gas is no longer eligible to create LGCs as of 2021. Any 2021 validations reflect LGCs that were created prior to 2021.
Description
This figure shows the combined large-scale generation certificates (LGC) spot and National Electricity Market (NEM) wholesale price for large-scale wind and solar photovoltaic (PV) generation. It also shows FID capacity in megawatts (MW).
This figure is interactive. Hover over/tap along the lines to see the capacity in megawatts (MW) or the revenue per MWh (megawatt hour) in Australian dollars (AUD). Click/tap on the items in the legend to hide/show data in the figure.
Small print
NEM data sourced from OpenNEM. LGC spot price sourced from CORE markets. FID data sourced through open source monitoring of announcements and by cross checking with independent industry analysts and directly with project developers.
