Key messages
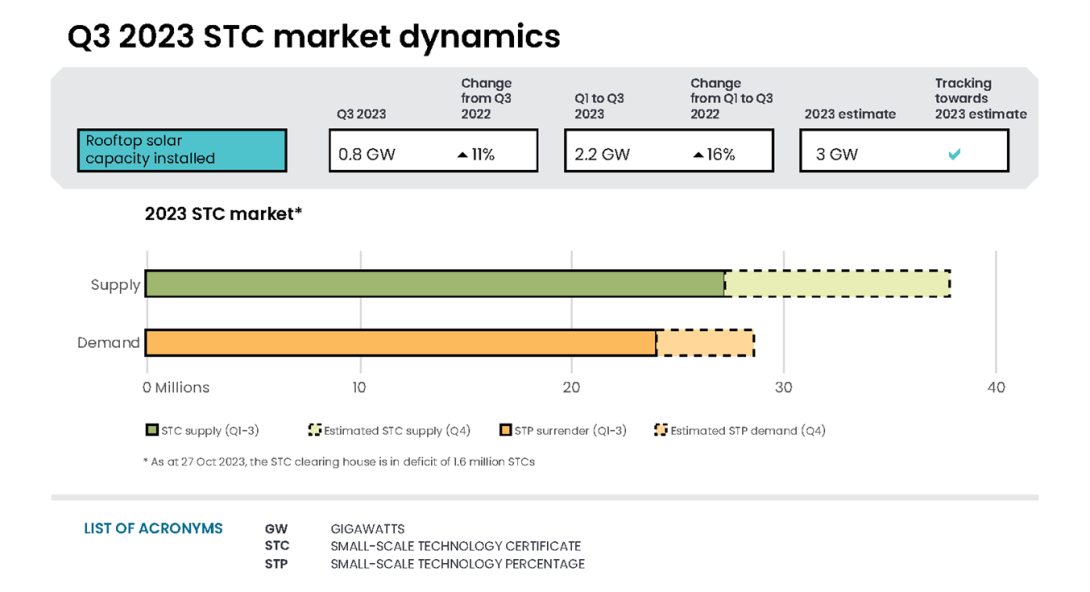
- In Q3 2023, 813 megawatts (MW) of rooftop solar capacity and an average system size of 9.3 kilowatts (kW) were installed. Both are Q3 records.
- In Q3 2023, 40,000 air source heat pumps (ASHPs) were installed. In the first 3 quarters of 2023, more than 101,000 ASHPs have been installed, exceeding the 2022 total of 87,000.
- 7.2 million STCs were surrendered for the Q3 compliance period, a compliance rate of 99.95%.
Market Dynamics
In Q3 2023, 9.6 million STCs were created. In the first 3 quarters of 2023, 27.4 million STCs were created. To meet the 2023 small-scale technology percentage (STP) of 16.29%, liable entities must surrender 28.5 million STCs. In Q3 2023, 7.2 million STCs were surrendered, a compliance rate of 99.95%. A total of 24.2 million STCs have been surrendered in the first 3 quarters of 2023.
STCs can be sold on the spot market or through the STC clearing house at a fixed price of $40 (excluding GST). If no STCs are available for sale in the STC clearing house, the Clean Energy Regulator (CER) can create STCs for buyers to purchase. This causes the clearing house to go into an effective deficit. If the clearing house is not in deficit, it is in an effective surplus. In an effective surplus, those who wish to sell STCs join the STC clearing house transfer list. This list works on a first-in-first-served basis, with STCs sold to buyers in order of the transfer list.
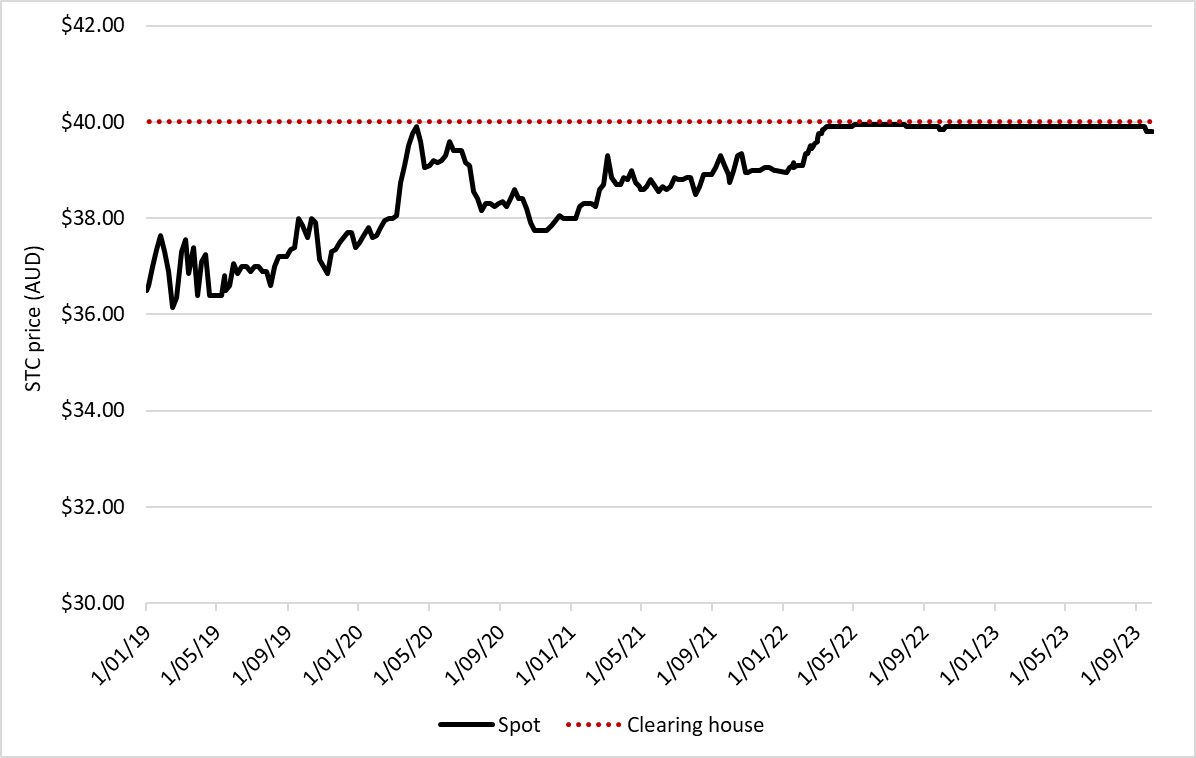
The status of the STC clearing house influences the STC spot price in the market. Following the Q2 surrender on 28 July 2023, the STC clearing house deficit increased to 4.3 million STCs and the spot price was $39.90. The STC clearing house returned to an effective surplus at the end of September 2023. Following the return to surplus, we saw more sales volume activity in the STC spot market and a slightly lower reported spot price of $39.80.
Following the Q3 surrender on 30 October 2023, the STC clearing house moved back to a deficit of 1.6 million STCs. This is the smallest post quarter deficit in 2023. We expect to move back to an effective surplus before the Q4 surrender on 14 February 2024 and will likely remain there in the short to medium term.
Insights
- Bigger rooftop solar systems and record quarterly capacity installed
- ASHP installations continue to break records
Bigger rooftop solar systems and record quarterly capacity installed
In Q3 2023, 88,000 rooftop solar systems were installed. This is 3,500 more systems compared to Q3 2022. A Q3 record was set for average rooftop solar system capacity at 9.3 kW in Q3 2023. This beat the previous Q3 record of 8.7 kW set in 2022. In Q3 2023, half of the rooftop solar systems installed had a capacity over 10 kW. Systems between 10-15 kW accounted for 27% of total installations, up from 20% in Q3 2022. As discussed in the Q2 2023 QCMR, this may be due to households preparing for electrification.
Description
This figure shows the proportion of small-scale solar PV systems installed each quarter under the Small-scale Renewable Energy Scheme (SRES) by capacity band in kilowatts (kW).
This figure is interactive. Hover over/tap each segment to see the percentage. Click/tap on the items in the legend to hide/show data in the figure.
Small print
Data as at 30 September 2023. A 12 month creation period for registered persons to create small-scale technology certificates (STCs) applies under the Renewable Energy (Electricity) Regulations (2001). Data is subject to change.
In Q3 2023, 813 MW of capacity was installed, a Q3 record. In the first 3 quarters of 2023, 2.2 GW of capacity was installed compared to 2.3 GW for the same period in the record year of 2021. Typically, the highest capacity is installed in Q4 each year. Hence, we may match the 2021 record of 3.2 GW in 2023 if we see a big Q4.
Description
This figure shows the quarterly new installed capacity, average system size, and number of small-scale solar PV installations.
This figure is interactive. Hover over/tap each bar to see the number of installations or the installed capacity in megawatts (MW). Click/tap along the line to see the average system size in kilowatts (kW). Click/tap on the items in the legend to hide/show data in the figure.
Small print
A 12 month creation period for registered persons to create small-scale technology certificates (STCs) applies under the Renewable Energy (Electricity) Regulations (2001). Data for installations and installed capacity in Q4 2022 to Q3 2023 have been lag-adjusted to account for the 12 month creation rule and are estimates only. The 2022 and 2023 installation and installed capacity figures may change.
The Solar Choice price index includes the total retail price (factoring in STC rebates) for rooftop solar systems. In October 2023, a 7 kW system cost around $7,190, with a payback period of around 4 years. This payback period is based on 40% of the solar produced being used by the household. Over the longer term, costs have fallen by approximately 18% since 2018. On average, a 7 kW system cost around $8,500 in 2018. Solar prices reached a low in October 2021 and then increased slightly until mid-2023. The Solar Choice price index suggests that prices have since begun to turn downwards. Many factors influence rooftop solar system prices. This includes the cost of materials, such as the panels themselves, labour and the offered STC rebate. It seems falling retail prices and rising energy costs are keeping payback periods relatively stable. These factors may help to partially offset the shorter deeming period.
Access to additional incentives from states and territories can further reduce upfront costs for rooftop solar systems for some households. For example, the Kimberly Communities Solar Saver program in WA announced on 17 November 2023.
In Q3 2023, 7% of systems were installed with a battery. Note, this data is voluntarily reported to the CER and the real proportion is likely higher. We encourage battery data to be supplied with STC applications. To the end of September 2023, there have been more than 17,000 reported battery installations. This is a 14% increase on the reported 15,000 batteries installed in the same period in 2022.
ASHP installations continue to break records
In Q3 2023, 40,000 ASHPs were installed. To the end of Q3 2023, more than 101,000 ASHPs were installed, exceeding the total 87,000 ASHPs installed in 2022.
In addition to support from the Small-scale Renewable Energy Scheme (SRES), state schemes are playing an important role in energy efficiency technology uptake. We saw NSW continue to lead the number of ASHP installations. To the end of Q3 2023, NSW installed 60,000 ASHPs, a near 700% increase on the 7,500 installed in the same period in 2022. ACT, NSW, SA and Victoria have incentives in place to assist consumers switch to ASHPs. We also expect installations in Queensland to increase. In September 2023, the Queensland Climate Smart Energy Savers rebate commenced.
Description
This figure shows the quarterly number of air source heat pump installations under the Small-scale Renewable Energy Scheme (SRES) by state and territory.
This figure is interactive. Hover over/tap each segment to see the number of installations. Click/tap on the items in the legend to hide/show data in the figure.
Small print
Where cell values are less than 10 data have been modified due to privacy considerations. In the figure these values appear as 10.
A 12 month creation period for registered persons to create small-scale technology certificates (STCs) applies under the Renewable Energy (Electricity) Regulations (2001). Data for installations in Q4 2022 to Q3 2023 have been lag-adjusted to account for the 12 month creation rule and are estimates only. The 2022 and 2023 installation and installed capacity figures may change.
Supplementary figures
Description
This figure shows how STC supply is tracking against the required amount to meet the 2023 STP.
This figure is interactive. Hover over/tap each bar to see the number of STCs. Hover over/tap along the lines to see the percentage or the required weekly supply. Click/tap on the items in the legend to hide/show data in the figure.
Small print
STC supply refers to the number of STCs that have passed validation. STP requirement refers to the number of STCs required to be created to meet the annual STP liability (34,400,000). Some weeks are spread across multiple months, the month label refers to the month as at the end of the week. The weekly data will not sum to the quarterly total.
Description
This figure shows the volume of STCs transacted and the number of transactions excluding STC clearing house transactions.
This figure is interactive. Hover over/tap each bar to see the number of STC transactions. Hover over/tap along the line to see the number of transactions. Click/tap on the items in the legend to hide/show data in the figure.
Small print
STC market transactions refer to all direct transfers (that is excluding STC clearing house transactions) of STCs between accounts.
Description
This figure shows STC supply each quarter from Q1 2019 to Q3 2023.
This figure is interactive. Hover over/tap each bar to see the number of STCs.
Small-scale technology certificate (STC) reported spot and STC clearing house prices
January 2019 to September 2023 Note: This figure is not interactive.
Description
This figure shows the STC spot price and STC clearing house price over time.
Small print
STC spot price sourced from CORE markets. Renewable Energy Target (RET) liable entities and other buyers who have a valid REC Registry account may buy STCs from the STC clearing house. If there are no STCs available for sale in the STC clearing house the Clean Energy Regulator (CER) will create 'CER created STCs' for buyers to purchase. CER created STCs can be traded and surrendered exactly like ordinary STCs. Small-scale renewable energy system owners and registered agents have the option to sell STCs through the open market for an uncapped price, or through the STC clearing house at a fixed price of $40 (excluding GST). Before STCs can be sold through the STC clearing house they must be validated and registered.
