
On this page
- Market dynamics
- Larger rooftop solar systems, high battery uptake in the NT and hot water heaters contribution to STC creations
Market dynamics
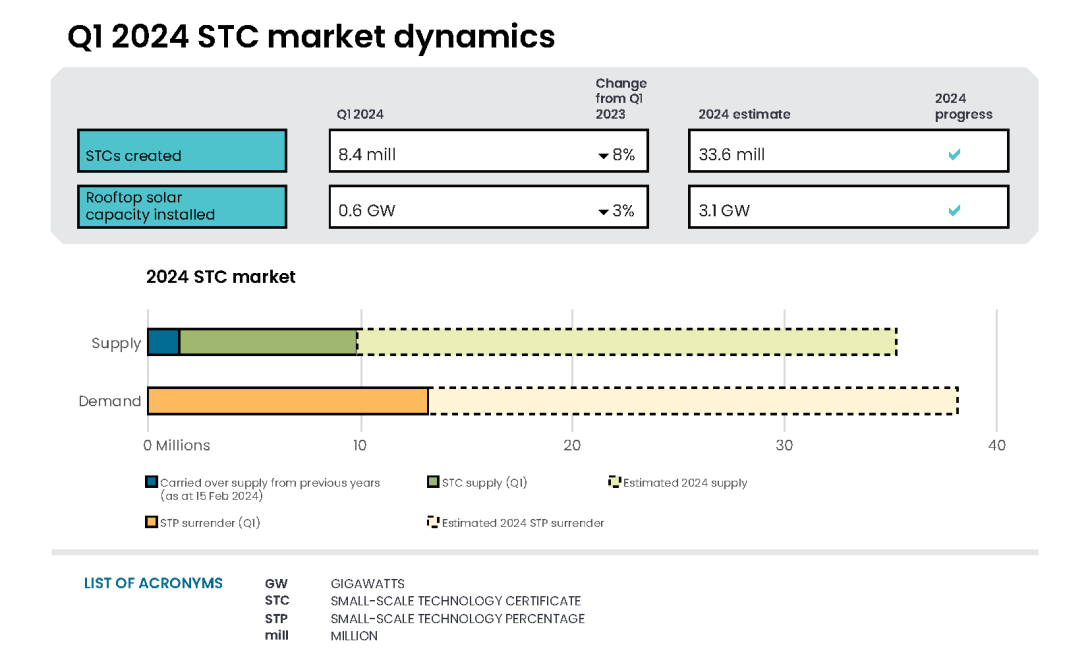
In Q1 2024, 8.4 million STCs were created. The 2024 small-scale technology percentage is 21.26%, which is equivalent to about 33.6 million STCs. The small-scale technology percentage surrender date for Q1 2024 was 29 April. For the Q1 2024 compliance period, 13.3 million STCs were required to be surrendered. 100% surrender and compliance rates were achieved with 13.1 million STCs surrendered and 0.23 million STCs in carried over surplus used.
Description
This figure shows the weekly supply of STCs in 2024. It also shows the required weekly supply of STCs (646,154) to meet the STP.
This figure is interactive. Hover over/tap each bar to see the number of STCs. Hover over/tap along the line to see the required weekly supply. Click/tap on the items in the legend to hide/show data in the figure.
Small print
Required STC supply refers to the estimated number of STCs to be created (33.6 million) to meet the annual STP liability and under/over supply from previous years. Some weeks are spread across multiple months, the month label refers to the month as at the end of the week.
Following the Q1 2024 compliance surrender, the STC clearing house was in a deficit of 2.2 million STCs.
The STC spot price started 2024 at $39.30. It stayed around this price until late February when the price started increasing to end Q1 2024 at $39.80. At the time of the Q1 surrender, spot prices were $39.90.
Small-scale technology certificate (STC) reported spot and clearing house prices
March 2019 to March 2024 Note: This figure is not interactive.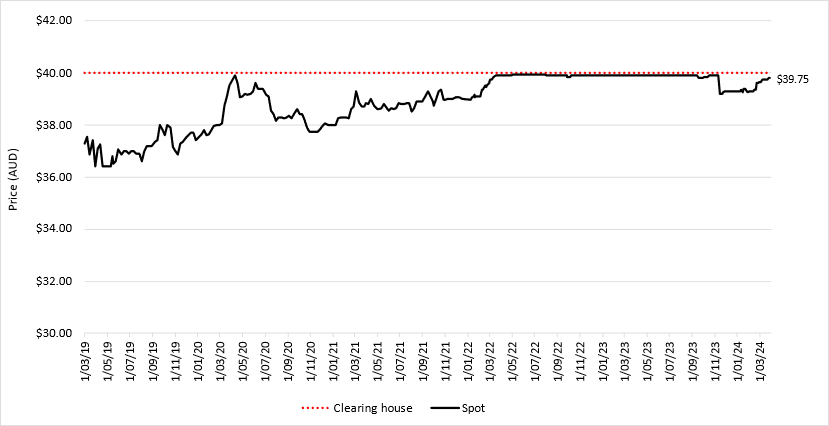
Description
This figure shows the STC spot price and STC clearing house price over time.
Small print
Pricing data is complied from trades reported by CORE markets and may not be comprehensive.
More information on buying and selling STCs, including through the clearing house is available on the Clean Energy Regulator's website.
Forward STC pricing suggests the market is anticipating a tight supply balance over the next 6 months. The clearing house is expected to periodically be in and out of deficit over the Q2 and Q3 surrender periods. It will likely return to surplus following surrender and then go back into deficit in the lead up to each surrender.
Larger rooftop solar systems, high battery uptake in the NT and hot water heaters contribution to STC creations
The continued trend of larger rooftop solar systems being installed is partially offsetting a reduction in the number of installations and the impact of a shorter deeming period. A 9.2 kilowatt rooftop solar system creates from 76 to 104 STCs, depending on where the system is installed.
Description
This figure shows the installed capacity in megawatts (MW), average system size in kilowatts (kW), and the number of small-scale rooftop solar installations over time.
This figure is interactive. Hover over/tap each bar to see the number of installations or the installed capacity. Click/tap along the line to see the average system size capacity. Click/tap on the items in the legend to hide/show data in the figure.
Small print
Small-scale rooftop solar systems must have a capacity of less than 100 kW. A 12 month creation period for registered persons to create small-scale technology certificates (STCs) applies under the Renewable Energy (Electricity) Regulations (2001). Data for installations and installed capacity in 2023 and 2024 have been lag-adjusted to account for the 12 month creation rule and are estimates only. Data is subject to change.
In Q1 2024, 5,700 systems (8%) were reported to be installed with a battery. Noting, this is voluntarily reported to us and the actual number is likely higher.
- In Q1 2024, 76 of the 162 rooftop solar systems installed in the NT were installed with a battery. Based on voluntarily reported data, the average usable capacity of these battery systems is around 9.5 kilowatt hours. These battery installations are supported by the NT government’s Home Battery and Business Scheme. It provides eligible homeowners and businesses a grant of $400 per kilowatt hour of useable battery system capacity, up to a maximum grant of $5000.
Description
This figure shows the number of air source heat pump installations under the Small-scale Renewable Energy Scheme (SRES) by state and territory over time. It also shows the number of STCs validated from these installations over time.
This figure is interactive. Hover over/tap each segment to see the number of installations. Hover over/tap along the line to see the number of STC validations. Click/tap on the items in the legend to hide/show data in the figure.
Small print
Where cell values are less than 10 data have been modified due to privacy considerations. In the figure these values appear as 10.
A 12 month creation period for registered persons to create small-scale technology certificates (STCs) applies under the Renewable Energy (Electricity) Regulations (2001). Data as at 17 May 2024 and has not been lag-adjusted. Data is subject to change.
On average, an air source heat pump installation in 2024 creates 22 STCs. In Q1 2024, energy efficient hot water heaters, including solar water heaters and air source heat pumps, accounted for 11% of STC creations.
Supplementary figures
Description
This figure shows the rooftop solar capacity installed under the Small-scale Renewable Energy Scheme (SRES) by state and territory over time.
This figure is interactive. Hover over/tap along the lines to see the installed capacity. Click/tap on the items in the legend to hide/show data in the figure.
Small print
A 12 month creation period for registered persons to create small-scale technology certificates (STCs) applies under the Renewable Energy (Electricity) Regulations (2001). Data for installations in 2023 and 2024 have been lag-adjusted to account for the 12 month creation rule and are estimates only. Data is subject to change.
Description
This figure shows the proportion of rooftop solar systems installed under the Small-scale Renewable Energy Scheme (SRES) by capacity band over time.
This figure is interactive. Hover over/tap each segment to see the percentage. Click/tap on the items in the legend to hide/show data in the figure.
Small print
A 12 month creation period for registered persons to create small-scale technology certificates applies under the Renewable Energy (Electricity) Regulations (2001). Data as at 31 March 2024 and is subject to change. Totals may not sum to 100% due to rounding.
Description
This figure shows the volume of STCs transacted and the number of transactions, excluding STC clearing house transactions over time.
This figure is interactive. Hover over/tap each bar to see the number of STCs transacted. Hover over/tap along the line to see the number of transactions. Click/tap on the items in the legend to hide/show data in the figure.
Description
This figure shows STC supply over time.
This figure is interactive. Hover over/tap each bar to see the number of STCs.