
Insights
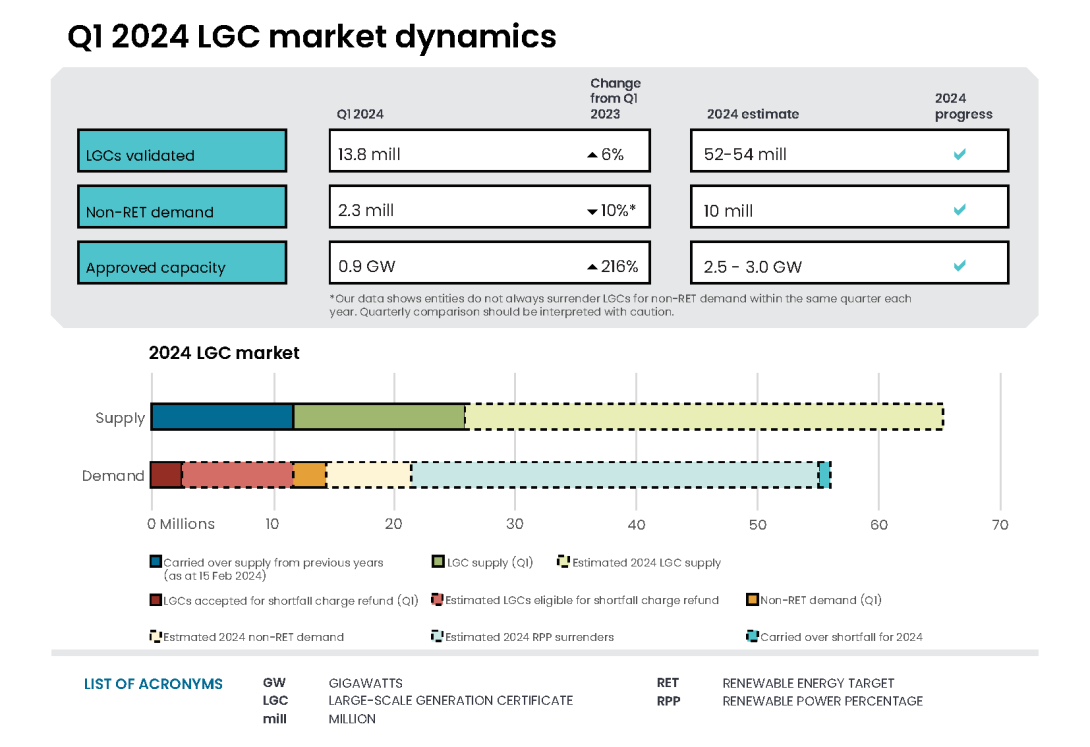
- In Q1 2024, the calendar year 2025 LGC price increased above the spot and current year (2024) prices for the first time. This is despite LGC holdings being 6.5 million higher than at the end of Q1 2023, a record Q1 supply of 13.8 million LGCs and an expected record annual supply of 52 to 54 million LGCs in 2024. Market intelligence suggests entities are securing future supply to meet voluntary commitments for 100% renewable energy by 2025. This is supported by almost half of holdings being held for non-Renewable Energy Target (non-RET) demand.
- In Q1 2024, 0.72 gigawatts (GW) of large-scale renewable power station capacity reached a final investment decision. This increased to 1.1 GW by May 2024. This continues the return to higher levels of investment as seen at the end of 2023. Two recent announcements relating to the Capacity Investment Scheme suggest 2024 will be a strong year for renewable investment announcements.
- On 22 April 2024, the Government announced the largest single renewable energy tender. This tender will help deliver 6 GW of renewable capacity with the project bids closing 1 July 2024. The first WA tender will open in June seeking 500 megawatts (MW) of four-hour equivalent dispatchable capacity. Projects are eligible if they are beyond ‘early development’ and have not reached ‘committed’ status prior to the Capacity Investment Scheme expansion announcement on 23 November 2023. This includes projects that have reached a final investment decision.
On this page
- Market dynamics
- Non-RET LGC demand on track for a record year
- LGC holdings grow, especially for non-RET demand purposes
- A Q1 record for large-scale capacity approved to generate LGCs
- Final investment decisions step up in the last 6 months
Market dynamics
Compared to Q1 2023, in Q1 2024 LGC validations for:
- wind increased by 0.23 million to 7.0 million
- solar increased by 0.58 million to 5.1 million
Description
This figure shows the number of LGCs validated by technology type over time.
This figure is interactive. Hover over/tap each segment to see the number of LGCs. Click/tap on the items in the legend to hide/show data in the figure.
Small print
Waste coal mine gas is no longer eligible to create LGCs as of 2021. Any 2021 validations reflect LGCs that were created prior to 2021.
The LGC spot price was $49.00 at the start of 2024. It then dropped to a low of $43.75 following the 2023 RPP surrender deadline on 14 February before recovering to $46.75 at the end of Q1 2024.
This drop in LGC spot price is typical following the annual RPP surrender. However, the 2024 drop was less than previously observed.
Large-scale generation certificate (LGC) reported spot and forward prices
March 2019 to March 2024 Note: This figure is not interactive.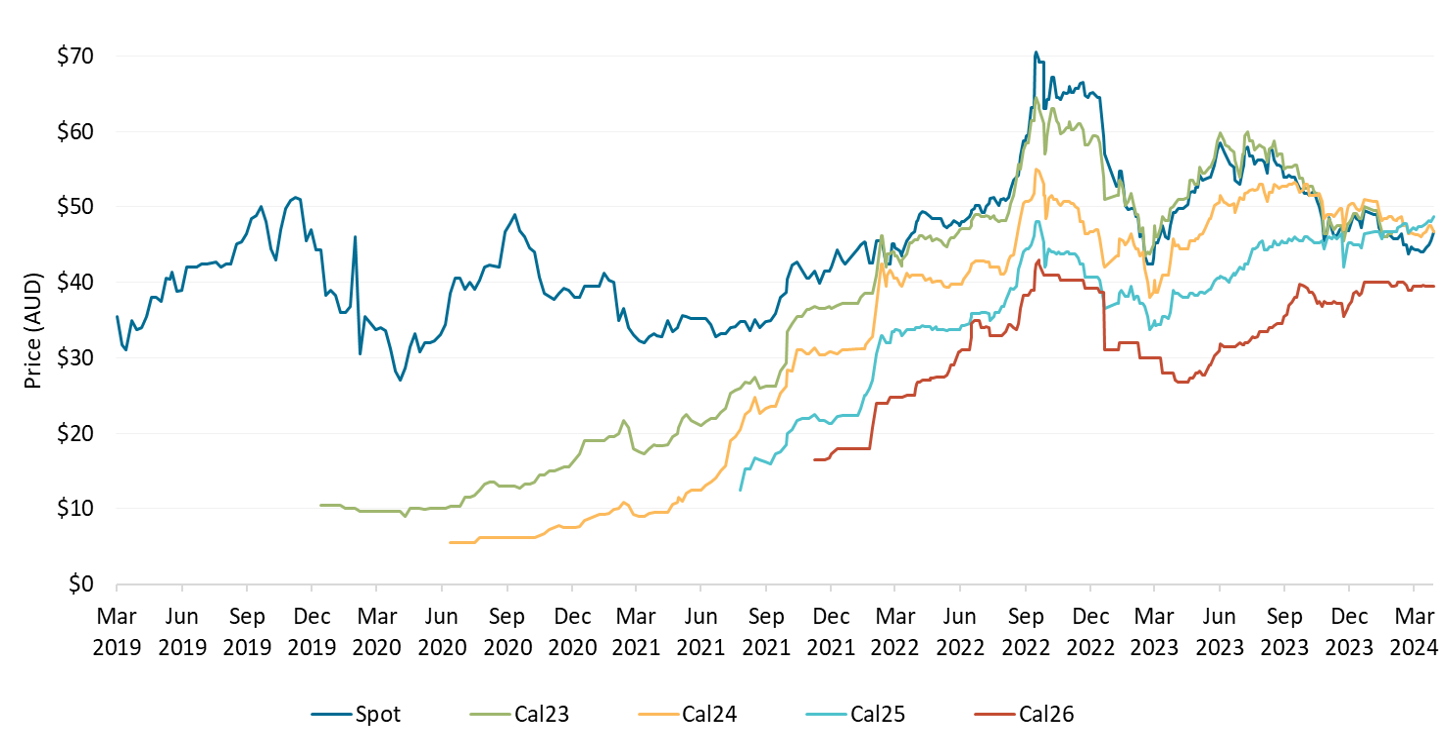
Description
This figure shows the LGC spot price and calendar year LGC forward prices over time. For example, Cal25 is the 2025 calendar year, where an agreement is made to buy/sell LGCs at a specified price in 2025.
Small print
Pricing data is compiled from trades reported by CORE markets and may not be comprehensive.
LGC demand in 2024 could be over 55 million LGCs, including:
- 33 million LGCs to be surrendered by liable entities to meet the 2024 renewable power percentage
- around 11.8 million LGCs eligible for shortfall refund. Of which:
- 3.3 million LGCs were accepted for refund in Q1 2024
- around 4 million are expected to be redeemed in Q2-Q4 2024
- around 0.47 million LGCs in carried forward liability
- around 10 million LGCs expected to be cancelled for non-RET demand.
Non-RET LGC demand on track for a record year
In Q1 2024, 2.3 million LGCs were cancelled for non-RET demand, an increase of 0.20 million compared to Q1 2023. Of which, 1.6 million (70%) were cancelled by the top ten entities.
Table: Top 10 entities that cancelled LGCs for non-RET demand in Q1 2024
| Account name | LGCs cancelled in Q1 2024 | Share |
|---|---|---|
| Red Energy Pty Ltd | 322,154 | 14% |
| EnergyAustralia Pty Ltd | 220,000 | 10% |
| Amazon Energy LLC | 185,087 | 8% |
| Natural Capital Partners Americas LLC | 183,706 | 8% |
| Iberdrola Australia Energy Markets Pty Ltd | 137,653 | 6% |
| Zen Energy Retail Pty Ltd | 136,222 | 6% |
| Sydney Desalination Plant Pty Ltd | 115,574 | 5% |
| ALDI Foods Pty Ltd | 109,663 | 5% |
| CleanCo Queensland Limited | 106,044 | 5% |
| Sydney Metro | 84,011 | 4% |
| Top 10 total | 1,600,114 | 70% |
| Other entities | 684,108 | 30% |
| Total non-RET cancellations | 2,284,222 | 100% |
Description
This figure shows non-RET LGC cancellations by demand source over time.
This figure is interactive. Hover over/tap each segment to see the number of LGCs. Click/tap on the items in the legend to hide/show data in the figure.
Small print
The classifications used in the figure are uniform across Australian carbon credit unit (ACCU) and LGC cancellations.
Covered activities for each classification
Voluntary demand
Cancellations made against voluntary certification programs such as Climate Active, and any sort of organisational emissions or energy targets.
Local, state and territory government demand
Cancellations on behalf of local, state and territory governments, for example to offset emissions from state fleets or meet emissions reduction targets.
Compliance demand
Cancellations by private organisations and corporations for compliance or obligations against municipal, local, state and territory government laws, approvals, or contracts. For example, to meet Environmental Protection Authority requirements.
Other demand
All activity not covered in the previous categories, primarily due to a lack of available information.
The Australian Government has set an Australian Public Service (APS) Net Zero 2030 Target. In 2022-23, 0.74 million (41%) of the 1.8 million megawatt hours (MWh) of electricity used was from renewable sources. This is equivalent to 0.74 million LGCs. If energy use remains consistent, an additional 1 million LGCs will be needed to meet 100% renewable energy each year.
LGC holdings grow, especially for non-RET demand purposes
At the end of Q1 2024, there were 21.1 million registered LGCs in holdings. The increasing proportion of holdings for non-RET demand may tighten the available LGC supply for liability purposes, including shortfall refunds.
Description
This figure shows LGC holdings in Renewable Energy Certificate (REC) Registry accounts by account holder category over time.
This figure is interactive. Hover over/tap each data point to see the number of LGCs. Click/tap on the items in the legend to hide/show data in the figure.
Small print
Holdings are for registered LGCs as at the end of the quarter and exclude any pending transactions. Accounts are categorised according to their primary role or function based on transaction patterns and the name of the account. An account's category is subject to change.
Definitions
Liable entity
Account holder is a liable entity.
Power station
Account holder has created LGCs.
Non-RET (voluntary)
Account holder has surrendered LGCs voluntarily. This includes accounts labelled as 'GreenPower' in the REC Registry.
Non-RET (government)
Account holder has surrendered LGCs voluntarily and is a government entity.
Non-RET (compliance)
Account holder has surrendered LGCs voluntarily for non-RET compliance reasons (for example, desalination plants) or the account holder is a Safeguard entity or related to a Safeguard entity.
Intermediary
Account holder has transacted/received over 1 million LGCs and does not fit in any of the other categories.
Other
Account holder does not fit into any of the other categories.
Several companies have renewable energy commitments, including 100% targets. The 2023 Corporate Emissions Reduction Transparency (CERT) report showed 6 of the 25 participating companies have a 100% renewable electricity by 2025 commitment. This includes:
- Coles Group Limited, whose LGC holdings increased by 135,000 compared to the same time last year
- Westpac Banking Corporation, whose LGC holdings increased by 19,000 compared to the same time last year.
Other entities are also holding LGCs, including:
- local, state and territory governments to meet voluntary commitments. For example, the ACT Government’s LGC holdings are 1.4 million higher than the same time last year. The ACT Government has been cancelling around 2.2 million LGCs per year since 2020.
- universities to meet voluntary commitments. For example, University of Sydney has a 100% renewable energy commitment. Compared to Q1 2023, its LGC holdings increased by 139,000.
- water desalination plants preparing for compliance cancellations. For example, compared to Q1 2023, AquaSure’s holdings increased by 410,000 LGCs and Water Corporation’s holdings increased by 106,000 LGCs.
For further detail, explore the volume of LGCs in the REC Registry by account name.
A Q1 record for large-scale capacity approved to generate LGCs
In Q1 2024, a Q1 record of 0.87 GW of large-scale renewable power station capacity was approved by the Clean Energy Regulator to generate LGCs. Of which, 0.59 GW was solar and 0.28 GW was wind. Once these projects are completed and generating at full capacity, this 0.87 GW of capacity could generate an additional 1.7 million LGCs each year.
Description
This figure shows the capacity of large-scale wind and solar power stations approved by the Clean Energy Regulator to generate large-scale generation certificates (LGCs) over time.
This figure is interactive. Hover over/tap each bar to see the capacity. Click/tap on the items in the legend to hide/show data in the figure.
Final investment decisions step up in the last 6 months
Power stations reaching a final investment decision in Q1 2024 included:
- Uungula wind farm in NSW (414 MW)
- Gunsynd solar farm in Queensland (94 MW)
- Munna Creek solar farm in Queensland (150 MW).
Description
This figure shows the capacity and four quarter rolling average of large-scale renewable power stations to reach a final investment decision over time.
This figure is interactive. Hover over/tap each bar to see the capacity. Hover over/tap along the line to see the rolling average of the previous four quarters. Click/tap on the items in the legend to hide/show data in the figure.
Small print
The Clean Energy Regulator tracks public announcements. Data may be incomplete and may change retrospectively.
Data as at 31 March 2024.
On 9 April 2024, the Queensland Government announced that the Aldoga Solar Farm (380 MW) had begun construction. The construction start date was used as a proxy for the final investment decision date. This announcement took total final investment decisions to 1.1 GW of capacity in 2024.
Additional information identified during Q1 2024 has resulted in final investment decision revisions for 2023. For Q4 2023, Forest Glen solar farm reached a final investment decision, bringing the 2023 total to 1.6 GW.
Supplementary figures
Large-scale generation certificate (LGC) spot price
March 2015 to March 2024 Note: This figure is not interactive.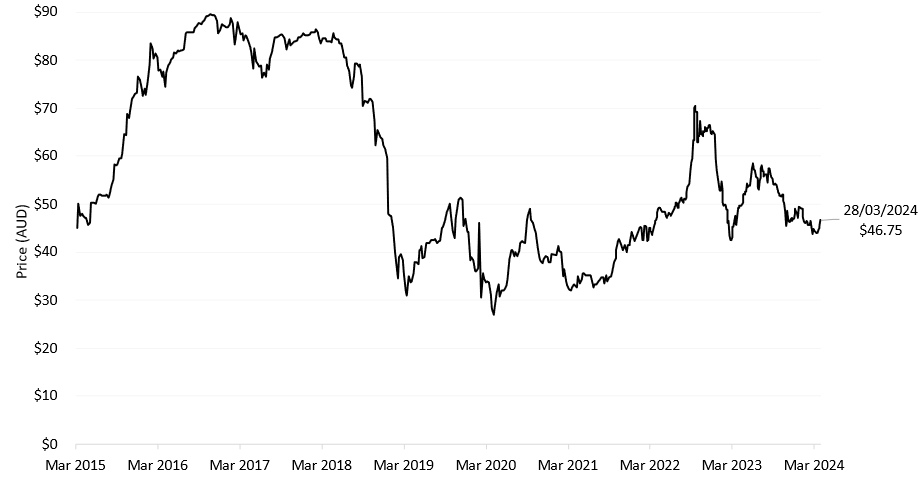
Description
This figure shows the LGC spot price over time.
Small print
Spot price data is compiled from trades reported by CORE markets and may not be comprehensive.
Description
This figure shows FID capacity in gigawatts (GW) over time. This figure also shows the potential revenue in Australian Dollars (AUD) per megawatt hour (MWh) for large-scale wind and utility solar generation over time. Potential revenue is calculated by adding the large-scale generation certificate (LGC) spot price and the National Electricity Market (NEM) wholesale price.
This figure is interactive. Hover over/tap along the lines to see the capacity or the potential revenue. Click/tap on the items in the legend to hide/show data in the figure.
Small print
The Clean Energy Regulator (CER) tracks public FID announcements, this information may not be complete and may change retrospectively. NEM data sourced from OpenNEM. LGC spot price sourced from CORE markets.
Data as at 31 March 2024.