
Insights
- Market dynamics
- Second highest rooftop solar capacity installed in 2023 and 2024 may break the record
- Larger rooftop solar systems installed in 2023, especially those with a battery
- NSW accounts for over half of all air source heat pump installations
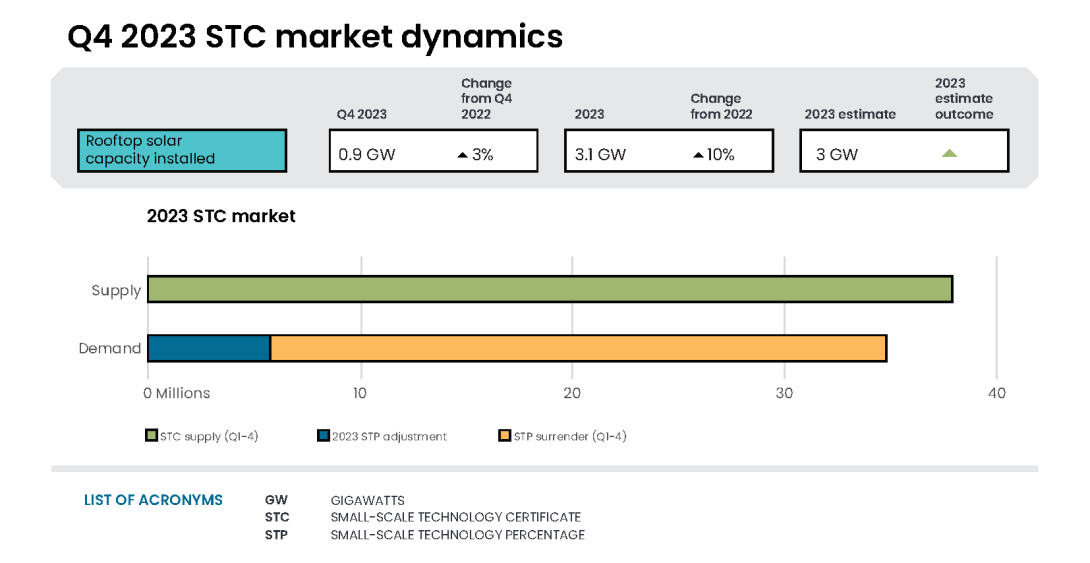
Market dynamics
In 2023, 37.3 million STCs were created, similar to the 38 million created in 2022.
The 2023 STP was set at 16.29%. To meet the 2023 STP obligations, liable entities (generally electricity retailers) were required to surrender approximately 28.5 million STCs. The 2023 STP was set lower as the STC clearing house had been in a deficit since April 2022. The Renewable Energy (Electricity) Act 2000 requires an STP adjustment to ensure supply and demand remain balanced.
Across the 2023 assessment year, a total of 29.2 million STCs were surrendered to meet the 2023 STP. This is a surrender rate of 103.23%. For the Q4 2023 compliance period, 5.0 million STCs were surrendered, a surrender rate of 102.79%. Entities can surrender more than 100% of their obligation to avoid shortfall. This also reduces the number of STCs that entities will need to surrender in future quarters.
The 2024 STP is set at 21.26%. Liable entities will be required to surrender approximately 37.9 million STCs to meet the 2024 STP. To calculate the STP, we engage consultants to model and estimate the number of STC creations for the following year. STCs in the clearing house and in accounts are also incorporated into the calculation of the STP. The modelling of STC creations includes a forecast of total rooftop solar installations. Total installations include new, additional and replacement rooftop solar systems.
Description
This figure shows the weekly supply of STCs. It also shows the required weekly supply of STCs to meet the STP and the weekly supply of STCs as a proportion of this required weekly supply.
This figure is interactive. Hover over/tap each bar to see the number of STCs. Hover over/tap along the lines to see the percentage or the required weekly supply. Click/tap on the items in the legend to hide/show data in the figure.
Small print
Required STC supply refers to the estimated number of STCs to be created (34,400,000) to meet the annual STP liability and under/over supply from previous years. Some weeks are spread across multiple months, the month label refers to the month as at the end of the week.
In Q4 2023, 9.9 million STCs were created, of which:
- 8.9 million were from rooftop solar installations
- 0.8 million were from air source heat pump installations
- 0.2 million were from solar water heater installations.
Following the Q4 2023 compliance surrender on 14 February 2024, the STC clearing house was in an effective surplus of over 0.45 million. The STC clearing house has been in an effective surplus since the end of September 2023. As at 15 February 2024, 5.5 million STCs were held in accounts.
The STC clearing house was in deficit from April 2022 to August 2023. During this time, the STC spot price fluctuated between $39.90 and $39.95, just below the STC clearing house price of $40 as the market remained tight.
During Q4 2023, STC supply and accumulation in accounts grew. This signalled to the market sufficient supply was available for the Q4 2023 STP surrender. The growing surplus in the STC clearing house and in accounts likely flowed through to small changes in the STC spot price. In Q4 2023, the STC spot price fell from $39.85 to $39.20 in mid-November. It then recovered slightly to $39.30 at the end of 2023.
Small-scale technology certificate (STC) reported spot and STC clearing house prices
January 2019 to December 2023 Note: This figure is not interactive.
Description
This figure shows the STC spot price and STC clearing house price over time.
Small print
STC spot price sourced from CORE markets. Renewable Energy Target (RET) liable entities and other buyers who have a valid REC Registry account may buy STCs from the STC clearing house. If there are no STCs available for sale in the STC clearing house the Clean Energy Regulator (CER) will create 'CER created STCs' for buyers to purchase. CER created STCs can be traded and surrendered exactly like ordinary STCs. Small-scale renewable energy system owners and registered agents have the option to sell STCs through the open market for an uncapped price, or through the STC clearing house at a fixed price of $40 (excluding GST). Before STCs can be sold through the STC clearing house they must be validated and registered.
Second highest rooftop solar capacity installed in 2023 and 2024 may break the record
In Q4 2023, 91,000 rooftop solar systems were installed. This brought the 2023 total to 331,000 rooftop solar system installations, compared to 316,000 in 2022.
In 2023, 3.1 GW of rooftop solar capacity was installed compared to 2.8 GW in 2022. This is the second highest annual capacity installed, just short of the record 3.2 GW installed in 2021. This exceeded our expectation of 3 GW.
NSW accounted for a third of the rooftop solar capacity installed in 2023. Over 1 GW of capacity was installed in NSW alone. This is a state and territory record, breaking the previous record of 0.85 GW installed in NSW in 2022. However, the highest installed capacity by population in 2023 was the ACT with 178 kW per 1,000 people. This was followed by Queensland (142 kW per 1,000 people), SA (139 kW per 1,000 people) and NSW (122 kW per 1,000 people).
Description
This figure shows the small-scale rooftop solar installed capacity under the Small-scale Renewable Energy Scheme (SRES) by state and territory over time.
This figure is interactive. Hover over/tap along the lines to see the installed capacity. Click/tap on the items in the legend to hide/show data in the figure.
Small print
A 12 month creation period for registered persons to create small-scale technology certificates (STCs) applies under the Renewable Energy (Electricity) Regulations (2001). Data for installations in 2023 have been lag-adjusted to account for the 12 month creation rule and are estimates only. The 2023 installed capacity figures may change and totals may not sum.
For 2024, the STP was calculated with a forecast of 3.1 GW of rooftop solar to be installed. If the higher rates of installations at the end of 2023 continue, installed capacity will exceed 3.1 GW and reach a new record in 2024. Small-scale renewables are a consumer product. Installations are tied to the economic conditions faced by households and small businesses. The upward trend in 2023 occurred despite increasing cost of living pressures facing Australian households. Higher energy costs and interest rates may be offset by the reduction in energy bills solar offers. Additionally, interest free loans, decreasing system costs and the Small-scale Renewable Energy Scheme (SRES) are keeping payback periods low at around 5 years. These factors are important considerations for consumers deciding whether to invest.
The SRES provides a financial incentive to install eligible small-scale renewable energy systems. An average sized rooftop solar system receives an effective rebate of around $4,200, equivalent to approximately one-third of the total system cost. Households and businesses replacing or adding capacity to existing rooftop solar systems may be eligible. The SRES is a high-volume scheme available to all with an aim to incentivise additional renewable energy.
Description
This figure shows small-scale rooftop solar replacements as a proportion of total installations by state and territory over time.
This figure is interactive. Hover over/tap along the lines to see the proportion. Click/tap on the items in the legend to hide/show data in the figure.
Small print
Replacement systems represent rooftop solar systems categorised in the Renewable Energy Certificate (REC) Registry as replacements.
In 2023, 21% of rooftop solar system installations were reported as replacement or additional systems. Solar systems may be replaced or added to for various reasons, including:
- outdated technology
- damage, such as hail damage
- to increase the solar capacity for the household or small business, including for electrification.
Larger rooftop solar systems installed in 2023, especially those with a battery
Rooftop solar system sizes continue to increase. In Q4 2023, the average system size was 9.8 kW, a quarterly record. In 2023, the average system size exceeded 9 kW for the first time, with an average of 9.3 kW per system. This is compared to 8.8 kW in 2022.
Description
This figure shows the installed capacity in megawatts (MW), average system size in kilowatts (kW), and number of small-scale rooftop solar installations over time.
This figure is interactive. Hover over/tap each bar to see the number of installations or the installed capacity. Click/tap along the line to see the average system size. Click/tap on the items in the legend to hide/show data in the figure.
Small print
Small-scale rooftop solar systems must have a capacity of less than 100kW. A 12 month creation period for registered persons to create small-scale technology certificates (STCs) applies under the Renewable Energy (Electricity) Regulations (2001). Data for installations and installed capacity in 2023 have been lag-adjusted to account for the 12 month creation rule and are estimates only. The 2023 installation and installed capacity figures may change.
In Q4 2023, 8,000 rooftop solar systems were reported to be installed with a battery. The average rooftop solar system size connected to a battery in Q4 2023 was 10.2 kW.
The Community Batteries for Household Solar program will install 400 batteries across Australia. This will provide shared storage for up to 100,000 households. The program is run by the Department of Climate Change, Energy, the Environment and Water (DCCEEW). The second battery, a 412 kilowatt hour (kWh), was switched on in NSW Central Coast, as announced on 3 November 2023.
NSW accounts for over half of all air source heat pump installations
In Q4 2023, 34,000 air source heat pumps were installed. This brought the 2023 total to 135,000 installations, compared to 87,000 installations in 2022.
Description
This figure shows the number of air source heat pump installations under the Small-scale Renewable Energy Scheme (SRES) by state and territory each quarter over time.
This figure is interactive. Hover over/tap each segment to see the number of installations. Click/tap on the items in the legend to hide/show data in the figure.
Small print
Where values are less than 10 data have been modified due to privacy considerations. In the figure these values appear as 10.
A 12 month creation period for registered persons to create small-scale technology certificates (STCs) applies under the Renewable Energy (Electricity) Regulations (2001). Data for installations in 2023 have been lag-adjusted to account for the 12 month creation rule and are estimates only. The 2023 installation figures may change.
NSW accounts for over half of all air source heat pump installations. Both the Peak Demand Reduction Scheme and Energy Savings Scheme continue to drive strong uptake in NSW. As noted in the Q2 2023 Quarterly Carbon Market Report (QCMR), these schemes allow for certificates such as energy savings certificates and peak reduction certificates to be stacked increasing the incentive.
In Q4 2023, Queensland installed 3,000 air source heat pumps, a Queensland record. This was driven by the Queensland Climate Smart Energy Savers Program. The program offered a rebate of up to $1,000 to buy and install eligible energy-efficient appliances, including air source heat pumps.
Supplementary figures
Description
This figure shows the volume of STCs transacted in millions and the number of transactions, excluding STC clearing house transactions over time.
This figure is interactive. Hover over/tap each bar to see the number of STCs transacted. Hover over/tap along the line to see the number of transactions. Click/tap on the items in the legend to hide/show data in the figure.
Description
This figure shows STC supply in millions over time.
This figure is interactive. Hover over/tap each bar to see the number of STCs.
Description
This figure shows the proportion of small-scale rooftop solar systems installed under the Small-scale Renewable Energy Scheme (SRES) by capacity band in kilowatts (kW) over time.
This figure is interactive. Hover over/tap each segment to see the percentage.
Small print
Data as at 31 December 2023. A 12 month creation period for registered persons to create small-scale technology certificates (STCs) applies under the Renewable Energy (Electricity) Regulations (2001). Data is subject to change.