
Insights
- Market dynamics
- Solar LGC validations grow, but wind still makes up the majority
- FID subdued in 2023
- Non-RET demand set a record in 2023 which will likely be broken again in 2024
- LGC forward prices strengthen
Market dynamics
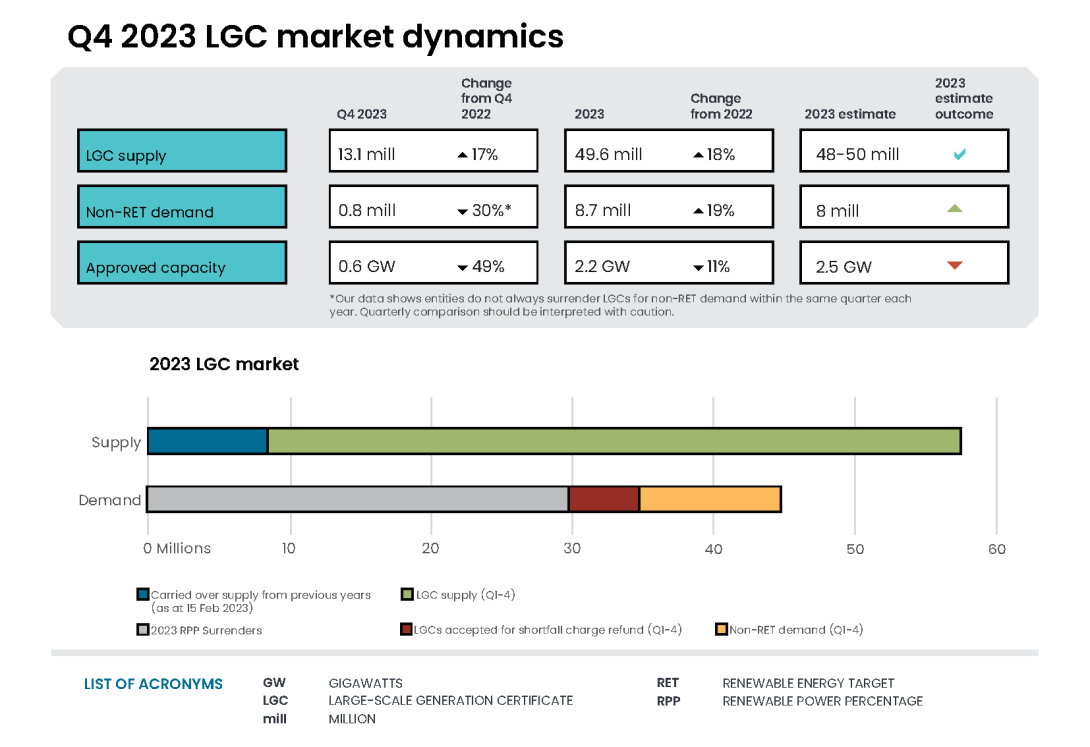
In 2023, 49.6 million LGCs were validated on the supply side. While total LGC demand was 43.9 million, where:
- 29.9 million LGCs were surrendered for 2023 RPP compliance on 14 February 2024.
- Some liable entities opted to take shortfall equal to 4.1 million LGCs, where a shortfall charge must be paid. In total, there is $841 million consolidated revenue in shortfall charges equivalent to around 13 million LGCs. These LGCs are eligible for refund over the next 3 years. This acts as an effective liquidity mechanism for liable entities. Additionally, around 0.5 million in LGC liability was carried forward for the 2023 RPP, as the shortfall was less than 10% of the entity’s obligation.
- 5.3 million LGCs were surrendered for shortfall refund. As this is more than the new shortfall taken, there was a net withdrawal from the market.
- 8.7 million LGCs were cancelled for non-RET demand purposes.
Table 3.1: Estimated LGC balance at the end of the 2023 assessment year
| Supply | Demand | |
|---|---|---|
| LGCs available from previous assessment years | +7.8 million | |
| 2023 LGC supply (available for 2023 surrender) | +49.6 million | |
| LGCs surrendered for the 2023 assessment year | -29.9 million | |
| Shortfall charge refunds | -5.3 million | |
| Non-RET cancellations | -8.7 million | |
| Estimated balance for the 2023 assessment year | +13.5 million | |
Following the 2023 RPP surrender on 14 February 2024 there were 16.5 million LGCs in holdings. This is 3 million more than the 13.5 million LGCs that are eligible for shortfall refund and carried forward liability. The LGC market is technically in a net surplus for the first time since 2018. This is due to more LGCs being in accounts than owed as shortfall. However, many LGCs in accounts seem to be being held for future voluntary use. These LGCs may be unavailable to meet other demands, such as shortfall.
The 2024 RPP has been set at 18.48%. Liable entities (generally electricity retailers) are required to surrender 33 million LGCs in 2024. Around 8.5 million LGCs are eligible for shortfall refund in 2024. We also expect 10 million LGCs for non-RET demand in 2024.
The LGC market will likely remain tight in 2024. For 2024 supply, we expect to validate 52 to 54 million LGCs. While demand could be up to 52 million LGCs, if the 2024 RPP is fully acquitted and all eligible shortfall is redeemed.
Solar LGC validations grow, but wind still makes up the majority
In Q4 2023, a record 13.1 million LGCs were validated, a strong end to 2023. Compared to 2022, 18% more LGCs were validated in 2023. In 2023, 49.6 million LGCs were validated, aligning with our estimate of 48 to 50 million LGCs. This included 30 million LGCs from wind and 15.5 million from solar compared to 26.5 million LGCs from wind and 11.8 million from solar in 2022.
Renewable generation and subsequent LGC supply can fluctuate. Many factors influence generation including weather conditions and natural disaster impacts. The Australian Energy Market Operator’s (AEMO) Quarterly Energy Dynamics (QED) report for Q4 2023 highlighted that higher solar irradiance increased grid-scale solar availability in all regions, while lower wind conditions reduced wind generation.
Description
This figure shows the number of LGCs validated by technology type over time.
This figure is interactive. Hover over/tap each segment to see the number of LGCs. Click/tap on the items in the legend to hide/show data in the figure.
Small print
Waste coal mine gas is no longer eligible to create LGCs as of 2021. Any 2021 validations reflect LGCs that were created prior to 2021.
In Q4 2023, 0.65 GW of newly completed capacity was approved by the CER to create LGCs. This included large solar power stations in NSW, Victoria and SA. In 2023, 2.2 GW of newly completed capacity was approved, of which 0.7 GW was wind. This fell short of our 2023 estimate of 2.5 GW. However, in early January 2024, 1 GW of wind and solar power station applications were under assessment by the CER.
In 2024, we expect to approve 2.5 to 3.0 GW of newly completed renewable power stations. We expect this to be from about 60% solar and 40% wind.
Around 8 GW of the 14.5 GW that reached a final investment decision (FID) in the past 5 years has been approved. This means at the end of 2023 about 6.5 GW is under construction. This capacity will likely be approved by the CER to create LGCs in 2024 to 2026 and could add around 17 million LGCs to total supply. Meanwhile new projects will continue to be added to this pipeline. The lag between FID and approval of power stations is discussed in the state of total renewables chapter.
Description
This figure shows FID and approved capacity in gigawatts (GW) over time. Large-scale renewable power stations are approved by the Clean Energy Regulator (CER) to generate large-scale generation certificates (LGCs). Typically, power stations take a minimum of 12 months to be built and reach first generation of electricity, with many taking much longer.
This figure is interactive. Hover over/tap each data point to see the capacity. Click/tap on the items in the legend to hide/show data in the figure.
Small print
The Clean Energy Regulator (CER) tracks public FID announcements, this information may not be complete and may change retrospectively.
Data as at 31 December 2023 for approved capacity.
Data as at 1 March 2024 for FID.
FID subdued in 2023
In Q4 2023, 3 new power stations totalling 0.8 GW reached FID. A total of 1.5 GW reached FID in 2023, with around 1 GW from solar and around 0.5 GW from wind and hybrid power stations. In January 2024, 0.56 GW reached FID, a positive start to 2024.
It is difficult to estimate how much capacity will reach FID in 2024. Developers continue to face several challenges including securing power purchase agreements (PPAs), connection approvals and sourcing components and labour. Our engagement with project developers suggests policy outcomes, such as the expanded Capacity Investment Scheme (CIS), are also playing a role. Some developers indicated the outcome of the CIS auctions will play a crucial role in the timing of announcements. We will continue to engage with project developers and the market to inform and report on outcomes throughout the year.
The Renewable Energy Target (RET) also supports renewable power stations and investment. The proposed Renewable Guarantee of Origin (REGO) certificate mechanism would continue certification beyond 2030 and build on the LGC framework. Once legislated, the REGO will support investment, especially when the REGO certificates can be appropriately valued in PPAs.
In November 2023, Infrastructure Partnership Australia released the Australian Infrastructure Investment Monitor 2023 report. The report includes survey results of international and Australian investor’s views. The report found renewables are an attractive investment, in particular batteries and other short duration storage assets as well as energy transmission and distribution. The report also found there are barriers to investment. This includes ensuring an adequate transmission network, ongoing supply chain constraints and skilled labour shortages.
Description
This figure shows the capacity and four quarter rolling average of large-scale renewable power stations to reach FID over time.
This figure is interactive. Hover over/tap each bar to see the capacity. Hover over/tap along the line to see the rolling average of the previous four quarters. Click/tap on the items in the legend to hide/show data in the figure.
Small print
The Clean Energy Regulator (CER) tracks public FID announcements, this information may not be complete and may change retrospectively.
Data as at 1 March 2024.
PPAs can be a lead indicator of potential FID announcements. A range of industries are entering into PPAs for new and existing renewable power stations, including the:
- mining industry - Rio Tinto signed a PPA with European Energy Australia to buy all energy generated from the 1.1 GW Upper Calliope solar farm for 25 years.
- IT industry - Equinix, Inc signed a PPA with TagEnergy for 151 megawatts (MW) of the Golden Plains Wind Farms.
Non-RET demand set a record in 2023 which will likely be broken again in 2024
In Q4 2023, 0.75 million LGCs were cancelled for non-RET demand. In 2023, an annual record of 8.7 million LGCs were cancelled for non-RET demand. This was lower than our revised estimate of 9.5 million LGCs largely due to cancellations occurring earlier than anticipated. For 2024, we expect a record 10 million LGCs to be cancelled for non-RET demand.
Description
This figure shows LGC cancellations by demand source over time.
This figure is interactive. Hover over/tap each segment to see the number of LGC cancellations. Click/tap on the items in the legend to hide/show data in the figure.
Small print
| Classification | Covered activities |
|---|---|
| Voluntary demand | Cancellations made against voluntary certification programs such as Climate Active, and any sort of organisational emissions or energy targets. |
| Local, state and territory government demand | Cancellations on behalf of local, state and territory governments, for example to offset emissions from state fleets or meet emissions reduction targets. |
| Compliance demand | Cancellations by private organisations and corporations for compliance or obligations against municipal, local, state and territory government laws, approvals, or contracts. For example, to meet Environmental Protection Authority requirements. |
| Other demand | All activity not covered in the previous categories, primarily due to a lack of available information. |
This classification system is uniform across Australian carbon credit unit (ACCU) and LGC cancellations.
A wide range of entities cancel LGCs to prove their use of renewable energy. Growth in non-RET demand was driven by the voluntary component of the market. In 2023, 4.9 million LGCs were cancelled for voluntary purposes. This was up 48% compared to the 3.3 million LGCs voluntarily cancelled in 2022.
Cancellations for Climate Active and GreenPower purposes grew. Compared to 2022 LGC cancellations increased by:
- 58% for Climate Active to 0.3 million
- 40% for GreenPower to 1.5 million.
Growth occurred across a broad range of industries, including the retail, real estate and transport sectors. These industries are cancelling both directly and through intermediaries. As discussed in the Q3 2023 Quarterly Carbon Market Report (QCMR), we expect changing policy and voluntary program participation to continue to drive this growth.
Our data shows companies with 100% renewable commitments are accumulating LGCs. For the financial year (FY)23 National Greenhouse and Energy Reporting (NGER) reporting year, the total reported scope 2 emissions were 75 million tonnes carbon dioxide equivalent (CO2-e). Scope 2 emissions are generally from the use of electricity. In FY23, NGER reporters consumed around 115,700 gigawatt hours (GWh) of electricity that was imported into facilities. This is equivalent to around 115.7 million LGCs. Substantial voluntary demand could be added if all NGER reporters progressively made and implemented commitments to use market-based accounting to report net zero for scope 2 emissions.
Available LGC supply and the spot price could impact voluntary demand growth. There will likely be a ceiling price where LGCs are perceived to be too expensive for voluntary demand. Alternatively, if the LGC spot price drops with sufficient supply, voluntary demand may increase.
On 12 December 2023, the Australian Competition and Consumer Commission (ACCC) released making environmental claims: a guide for business. The guide includes 8 principles. Principle 5 is to avoid broad and unqualified claims. The guidance recommends the use of tradeable certificates associated with electricity generation. The guidance also states when making renewable energy claims with LGCs, they must be cancelled to avoid double counting.
LGC forward prices strengthen
LGC prices are determined by the market. Numerous factors influence LGC prices, including supply, demand and policy.
Large-scale generation certificate (LGC) spot price
January 2015 to December 2023 Note: This figure is not interactive.
Description
This figure shows the LGC spot price from January 2015 to December 2023.
Small print
Pricing data is compiled from trades reported by CORE markets, and may not be comprehensive.
In February 2023, the LGC spot price dropped to a low of $39.75. This February drop is typical following the annual RPP surrender. The LGC spot price recovered to a peak of $58.75 in June 2023 and then fell steadily in Q3 2023. In Q4 2023, the LGC spot price fluctuated between $45.50 and $52.00. The increasing LGC spot price following the annual RPP surrender is typical. This occurs as liable entities secure supply to meet their next RPP compliance obligations. In Q3 and Q4 each year, the LGC spot price typically drops and stabilises. This occurs as companies realise sufficient LGCs are available, or they have secured sufficient LGCs to meet their compliance obligations.
Following the expanded CIS announcement on 23 November 2023, the LGC spot price dropped to $45.50 before recovering quickly to above the preannouncement price. The LGC spot price was $49.50 at the end of 2023. It then settled back to about $44 after the 2023 RPP surrender on 14 February 2024.
Large-scale generation certificate (LGC) reported spot and forward prices
December 2022 to December 2023 Note: This figure is not interactive.
Description
This figure shows the LGC spot price and calendar year forward prices over the last 12 months. For example, Cal24 is the 2024 calendar year.
Small print
Pricing data is compiled from trades reported by CORE markets, and may not be comprehensive.
Forward contracts are an agreement to buy LGCs at a specified price at a specified time. Over 2023, forward prices for future vintages strengthened. Much of this growth was seen in near term vintages. Prices for calendar year (CY)24 and CY25 LGCs increased by $4.12 and $8.39 respectively in 2023. Market intelligence suggests there are several reasons entities may enter into forward contracts. This includes ensuring supply to meet:
- future RPP obligations
- current or anticipated future shortfall
- renewable energy commitments, such as 100% renewable energy by a specified year.
The compression between forward and spot prices in 2023 continues a pattern observed in previous years.
Supplementary figures
Description
This figure shows FID capacity in gigawatts (GW) over time. This figure also shows the potential revenue in Australian Dollars (AUD) per megawatt hour (MWh) for large-scale wind and utility solar generation over time. Potential revenue is calculated by adding the large-scale generation certificate (LGC) spot price and the National Electricity Market (NEM) wholesale price.
This figure is interactive. Hover over/tap along the lines to see the capacity or the potential revenue. Click/tap on the items in the legend to hide/show data in the figure.
Small print
The Clean Energy Regulator (CER) tracks public FID announcements, this information may not be complete and may change retrospectively. NEM data sourced from OpenNEM. LGC spot price sourced from CORE markets.
Data as at 31 December 2023 for wholesale prices (wind and solar) and LGC price.
Data as at 1 March 2024 for FID.