
For this publication the National Greenhouse and Energy Reporting (NGER) data is grouped into Australian states and territories, and presented by Australian and New Zealand Standard Industrial Classification (ANZSIC) division, which is a system that was developed for use in both countries for the production and analysis of industry statistics.
Corporations assign an ANZSIC code to each facility, based on its predominant activity. ANZSIC codes are broken up into divisions, subdivisions, classes and subclasses. Information has been presented at the ANZSIC division level.
It is a legislative requirement that, except when expressly permitted, individual reporters cannot be identified when NGER data is published. Where an ANZSIC division has too few facilities represented, the aggregated data has not been included in the division. Instead this data is collectively published in a separate line item. This is also the reason that some states and territories have been grouped together.
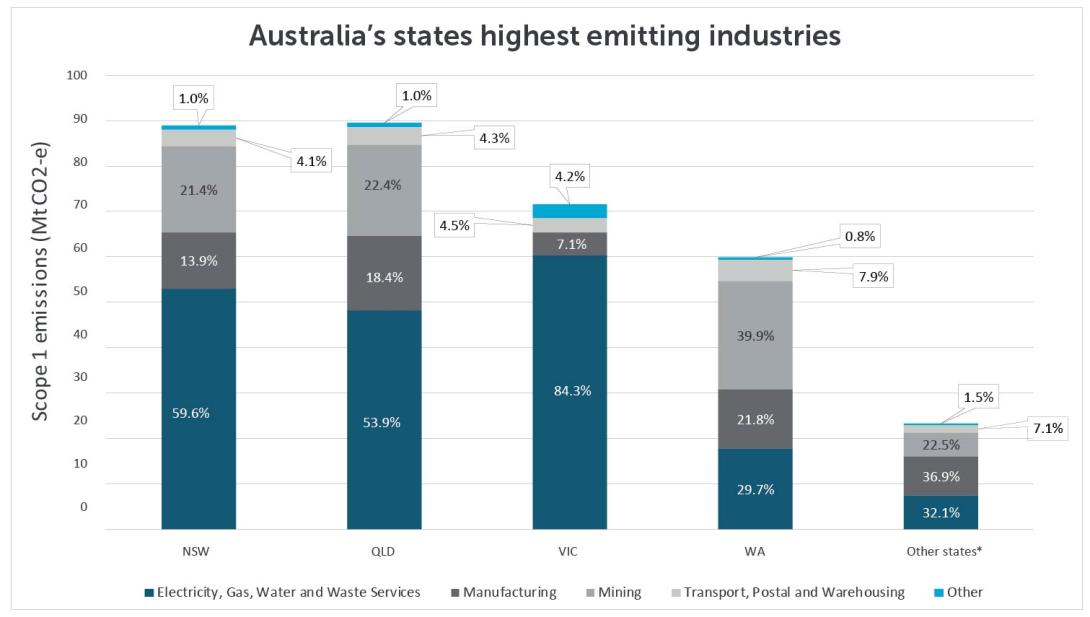
The ANZSIC divisions with the most emissions are presented at the state and territory level for 2015-16. The highest emissions are reported in the electricity, gas, water and waste services division for each state and territory presented in the table, except for Western Australia, where the highest emitting industry is mining. The other high emitting industries are manufacturing, mining, transport, postal, and warehousing.
This data set will be updated by April each year to include the latest reported data available.
This chart and dataset reflects changes in global warming potential factors for carbon dioxide equivalent emissions which came into effect in the 2015-16 reporting period.
The data in this publication has undergone a quality assurance process and adjustments to reported ANZSIC subdivisions have been made where appropriate.
As ANZSIC codes are self-reported, the Clean Energy Regulator cannot guarantee the accuracy of the codes chosen by reporters although efforts have been made to identify any significant errors.
Some data has been withheld in some categories to ensure anonymity of reporters which is required under the legislation.
Data in this publication is at 12 April 2017. Note that it may differ from the published February data.
| ANZSIC Division | Electricity, Gas, Water and Waste Services | Manufacturing | Mining | Transport, Postal and Warehousing | Construction | Other |
|---|---|---|---|---|---|---|
| NSW | 49,723,116 | 12,087,709 | 16,539,048 | 3,721,970 | n/a | 830,347 |
| QLD | 47,176,416 | 13,989,016 | 18,863,867 | 3,957,986 | n/a | 1,057,469 |
| VIC | 61,800,021 | 5,193,279 | n/a | 3,072,885 | 99,410 | 2,784,696 |
| WA | 17,353,443 | 13,352,276 | 21,573,148 | 4,874,165 | n/a | 491,231 |
| Other states* | 7,159,005 | 8,729,007 | 5,529,023 | 1,706,126 | n/a | 285,304 |
State and territory scope 1 emissions by ANZSIC division national totals
For detailed information on the dataset for State and territory scope 1 emissions by ANZSIC division for 2014-15 and 2015-16 download the excel spreadsheet. For a subset of this data see the below table.
Notes about this table: some of the totals contain withheld items due to confidentiality
State and territory scope 1 emissions by ANZSIC division for 2014-15
State and territory scope 1 emissions by ANZSIC division for 2015-16
| ANZSIC Division | Scope 1 emissions | Number of facilities |
|---|---|---|
| ACCOMMODATION AND FOOD SERVICES | 92,172 | 181 |
| ADMINISTRATIVE AND SUPPORT SERVICES | 39,235 | 230 |
| AGRICULTURE, FORESTRY AND FISHING | 311,249 | 283 |
| ARTS AND RECREATION SERVICES | 0 | 0 |
| CONSTRUCTION | 279,505 | 150 |
| EDUCATION AND TRAINING | 118,496 | 141 |
| ELECTRICITY, GAS, WATER AND WASTE SERVICES | 186,769,602 | 916 |
| FINANCIAL AND INSURANCE SERVICES | 39,060 | 127 |
| HEALTH CARE AND SOCIAL ASSISTANCE | 217,826 | 629 |
| INFORMATION MEDIA AND TELECOMMUNICATIONS | 38,100 | 262 |
| MANUFACTURING | 55,518,332 | 1,521 |
| MINING | 68,186,264 | 850 |
| OTHER SERVICES | 65,376 | 94 |
| PROFESSIONAL, SCIENTIFIC AND TECHNICAL SERVICES | 44,458 | 134 |
| PUBLIC ADMINISTRATION AND SAFETY | 0 | 0 |
| RENTAL HIRING AND REAL ESTATE SERVICES | 137,622 | 498 |
| RETAIL TRADE | 0 | 0 |
| TRANSPORT, POSTAL AND WAREHOUSING | 17,089,260 | 1,230 |
| WHOLESALE TRADE | 218,533 | 537 |
| Total of withheld items | 4,438,459 | 912 |