National Greenhouse and Energy Reporting (NGER) data is collected from corporations and facilities that meet a reporting threshold. In February each year, the Clean Energy Regulator publishes corporation emission and energy data.
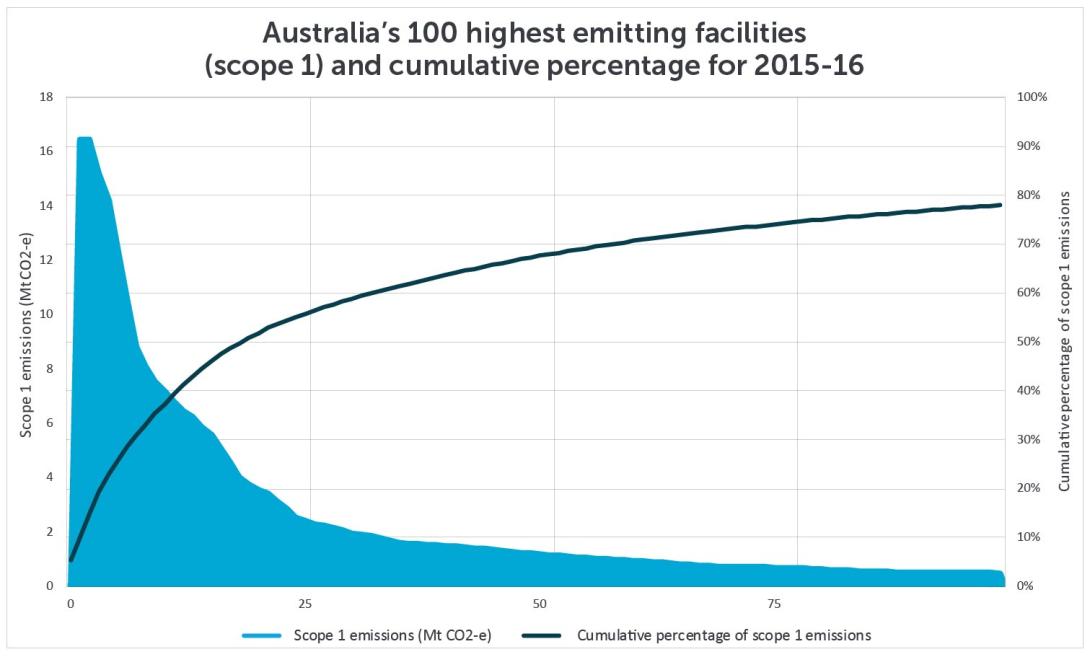
The first graph represents the 100 highest emitting facilities by scope 1 emissions in 2015-16. It shows that the 100 highest emitting facilities report more than 75 per cent of the scope 1 emissions under NGER. The highest 25 emitting facilities represent approximately 55 per cent of the total emissions reported under NGER.
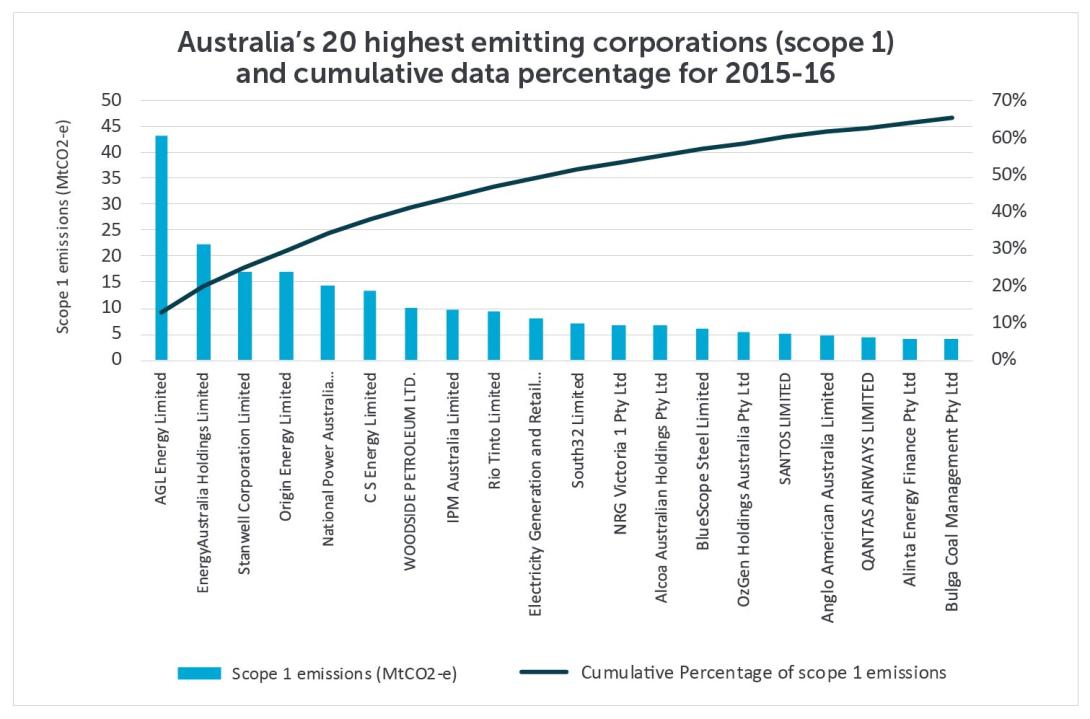
For this publication, data for Australia’s 20 highest emitting corporations (scope 1) and their cumulative data for 2015-16 have been extracted to create the bar graph. The graph also shows the cumulative total of each corporation compared with the total NGER data set which contains information reported by more than 700 corporations and 8000 facilities. The 20 highest emitting corporations represent almost 65 per cent of the scope 1 emissions reported under NGER.
This data set will be updated by April each year to include the latest reported data available.

\
