Large-scale generation certificates (LGCs)
Key messages
- 432 MW of new capacity reached final investment decision (FID) in Q1 2023 with a solid pipeline of potential announcements for the rest of the year.
- 384 MW was approved for LGC creation.
- LGC supply increased 28% compared to Q1 2022 with the year on year increase expected to be about 7-14%.
- Voluntary cancellations reached a new Q1 record of 1.2 million LGCs and we expect a new record for non-Renewable Energy Target (RET) demand will be set this year.
- LGC spot prices have recovered from a low of $42.50 in mid-February to be back over $52 per certificate in Q1 2023.
- Near-term (2023 - 2025) forward prices have also seen increases suggesting the market is still pricing in the future scarcity of certificates.
Large-scale renewable energy investment
As discussed in the Q4 2022 Quarterly Carbon Market Report (QCMR), we were expecting a modest capacity reaching FID in Q1 2023 following a quarterly record in Q4 2022 with most of that announced in December 2022.
There was 432 MW of proposed wind and solar power stations that reached FID in Q1 2023 (see Figure 2.1). As we have said before, given the commercial nature of FID decisions it is always challenging to estimate the capacity for the year and trends can't be called on quarter to quarter comparisons.
In the Q4 2022 QCMR we said we expected a similar level of capacity to reach FID this year as the 4.3 GW in 2022. We routinely engage with industry, including with project developers with projects on our probable list. Our analysis currently suggests about 3 to 3.5 GW total reaching FID in the 2023 calendar year. Noting we regularly see announcements we weren’t expecting given the commercial nature of these decisions. There is substantial momentum in announcements (see Figure 2.2). We believe total FID capacity in 2023 may get close to 2022 levels given trends and strong investment signals. Q2 2023 is likely to also see a modest capacity achieving FID and the second half of the 2023 calendar year is expected to be much larger than the first half.
Description
This graph shows final investment decision capacity of large-scale renewable energy power stations each quarter, and a four-quarter rolling average.
Small print
Note: The CER tracks public announcements. The above information may not be complete and may change retrospectively.
Data as at 5 April 2023.
We continue to advise caution in comparing quarterly FID data as these commercial decisions can be ‘lumpy’. We will continue to monitor and report on investment levels going forward.
Figure 2.2 shows the capacity reaching FID broadly follows a similar trend to combined electricity and LGC price signal but with a lag. These combined prices have increased materially since 2021, suggesting a potential increasing investment in renewable energy after 2022, especially the 2024-25 calendar years.
Description
This graph shows the combined large-scale generation certificates (LGC) spot and National Electricity Market (NEM) wholesale price for large-scale wind and solar PV generation.
Commercial opportunities remain for renewable energy project developers to replace the earlier coal plant closures and to meet the Australian Government's goal of 82% renewables share of electricity generation by 2030. Challenges continue to include risk premiums in engineering, procurement and construction (EPC) contracts, component costs and transmission constraints (see Q4 2022 QCMR for more discussion on this topic).
The Treasurer, Minister and Assistant Minister for Climate Change and Energy held an investor roundtable on 21 April 2023 to align efforts to deliver cleaner, cheaper energy. The 3 key outcomes were:
- Sovereign green bonds slated to commence in mid-2024.
- Expanding energy efficiency ratings.
- Boosting the integrity of green investments.
Total renewable energy generation continues to increase
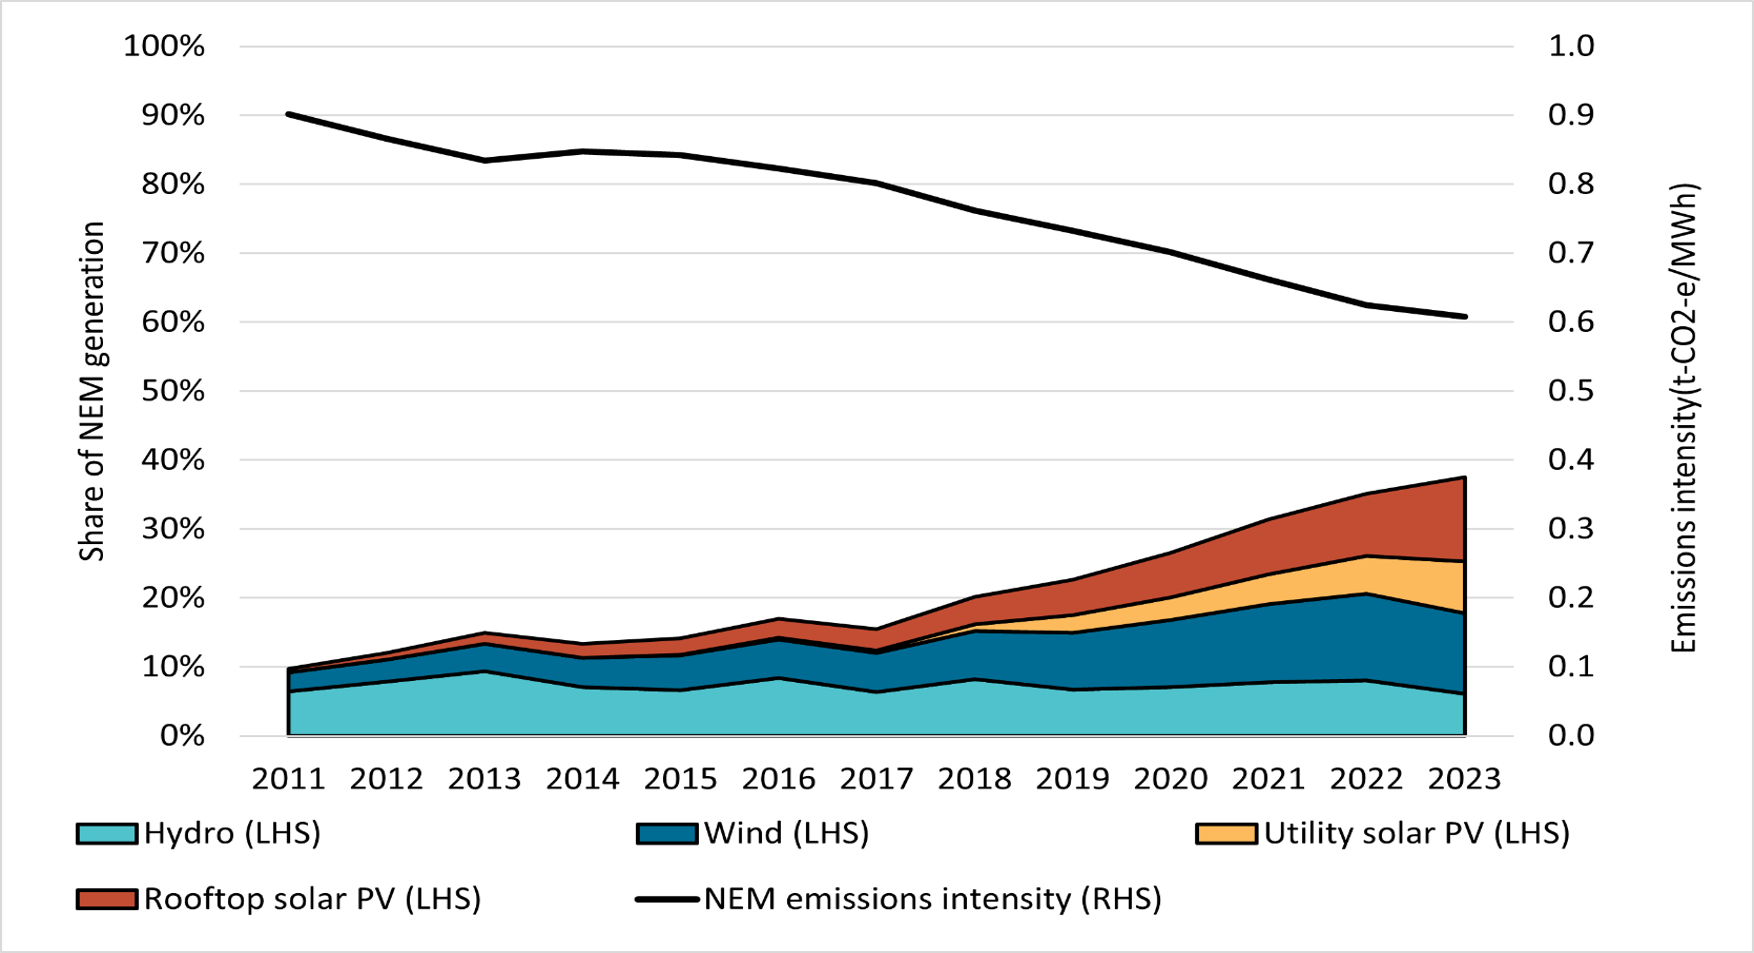
So far in 2023, renewables (including rooftop solar photovoltaic (PV)) contributed 39% of total National Electricity Market (NEM) generation, up 4 percentage points from 2022 (see Figure 2.3). The continued increased penetration of renewables in the NEM has contributed to lower emission intensity. Compared to Q1 2022, renewable energy generation in the NEM increased by 12% with utility-scale solar and rooftop solar PV growing over 23% during the year according to OpenNEM.
AEMO's 2023 Q1 Quarterly Energy Dynamics report shows that the growing penetration of renewable energy has reduced operational demand during the day. The impact on wholesale electricity prices has been significant, driving an increase in negative price events and contributing to an overall reduction in wholesale prices when wind and solar are setting prices.
Renewables generation share in the National Electricity Market (NEM)
2011 to 2023 Note: This figure is not interactive.
Description
This graph shows the share of NEM generation contributed by renewables and the emissions intensity of the NEM.
Small print
A small portion of renewable generation, including biomass, is not shown.
Credit
Generation and emissions intensity data sourced from OpenNEM on 18 April 2023.
In terms of future additional renewable energy generation, preliminary estimates of the capacity of wind and solar power stations reaching first generation in 2023 should be between 2.5 and 3 GW. We are expecting this to increase in 2024 and beyond, particularly off the back of 4.3 GW reaching FID in the 2022 calendar year. We will provide some analysis on this likely increase in the Q2 2023 QCMR.
LGC market dynamics
It was a strong Q1 for 2023 with a record 13 million LGCs created, an increase of 28% on Q1 2022, largely due to the increase in creations from solar (see Figure 2.3). We expect LGC supply to be 45 to 48 million in 2023 which would be a 7-14% increase year on year. In Q1 2023, 384 MW of capacity was approved for LGC generation.
The spot LGC price finished Q1 2023 at $49.25, added a further $3 by the end of April and then increased further. In the context of the cost of new build wind and solar, this is still a material incentive in addition to wholesale electricity prices. The RET still has more than 7.5 years until the scheme finishes at the end of 2030. The proposed Guarantee of Origin (GO) scheme for hydrogen and renewable energy will, if legislated, provide a way for renewable energy projects to generate tradable certificates (renewable energy guarantee of origin certificates or REGOs) beyond LGCs. However, we acknowledge there is currently uncertainty over the potential value of REGOs beyond 2030.
Some market participants had expressed concern over what they perceived as possible over-supply of certificates from the policy proposal for REGO certificates for baseline generation.5 Some in the industry believed REGOs could see reduced demand for LGCs. As discussed in the Q4 2022 QCMR, the Clean Energy Regulator (CER) does not hold this view and has been working with the Department of Climate Change, Energy, the Environment and Water to engage with industry to discuss concerns. This below-baseline generation is progressively obtaining International Renewable Energy Certificates (I-RECs) and we believe most are already contracted.
One key factor at play is ongoing shortfall charge taken and expected shortfall charge redemption (see Q4 2022 QCMR for an in-depth discussion) and the effective 15.5 million LGC deficit. The other important demand side factor is increasing voluntary surrender of LGCs to prove use of renewable energy.
Non-RET LGC demand
Non-RET LGC cancellations increased by 71% in Q1 2023 compared to the same period in 2022 from 1.2 million to 2.1 million LGCs (see Figure 2.4). The strong increase was driven by voluntary cancellations which reached a new quarterly record for Q1 2023 of 1.2 million LGCs cancelled. A wide range of organisations cancelled LGCs in Q1 2023 including retailers, local governments and construction companies that reflects the growing importance of voluntary net zero commitments in the private sector. Nearly 80% of cancellations occurred in March 2023.
Description
This graph shows LGC cancellations broken out by demand source.
Small print
| Classification | Covered activities |
|---|---|
| Voluntary demand | Cancellations made against voluntary certification programs (such as Climate Active and GreenPower) and organisational emissions or energy targets. |
| Local, state and territory government demand (LS&T) | Cancellations on behalf of local, state and territory governments, such as to meet state renewable energy targets or offset emissions from state fleets. |
| Compliance demand | Cancellations by private organisations and corporations for compliance or obligations against municipal, local, state and territory government laws, approvals, or contracts. For example, to prove renewable energy for desalination or state Environmental Protection Agency requirements. |
| Other demand | All activities not covered in the previous categories, primarily due to lack of information available. This grouping has declined substantially as part of these new classifications. |
This classification system is uniform across ACCU and LGC cancellations.
While this level of growth year on year for Q1 may not be sustained throughout the year, demand from individual renewable energy commitments is expected to again see significant growth this year. This will likely see non-RET cancellations in 2023 materially surpass the 7.4 million cancelled in 2022. We estimate a minimum of 8 million LGCs will be cancelled against non-RET demand in 2023, but it could go much higher. The level of voluntary demand growth will be an important watch point for the rest of this year.
There is no limit on voluntary cancellations of LGCs. Programs such as GreenPower and Climate Active recognise the cancellation of LGCs to prove use of renewable electricity. LGCs are an important source of voluntary cancellations as evidenced in the Corporate Emissions Reduction Transparency (CERT) report. Voluntary cancellations of LGCs comprised 32% of certificate surrenders in 2022.
LGC prices
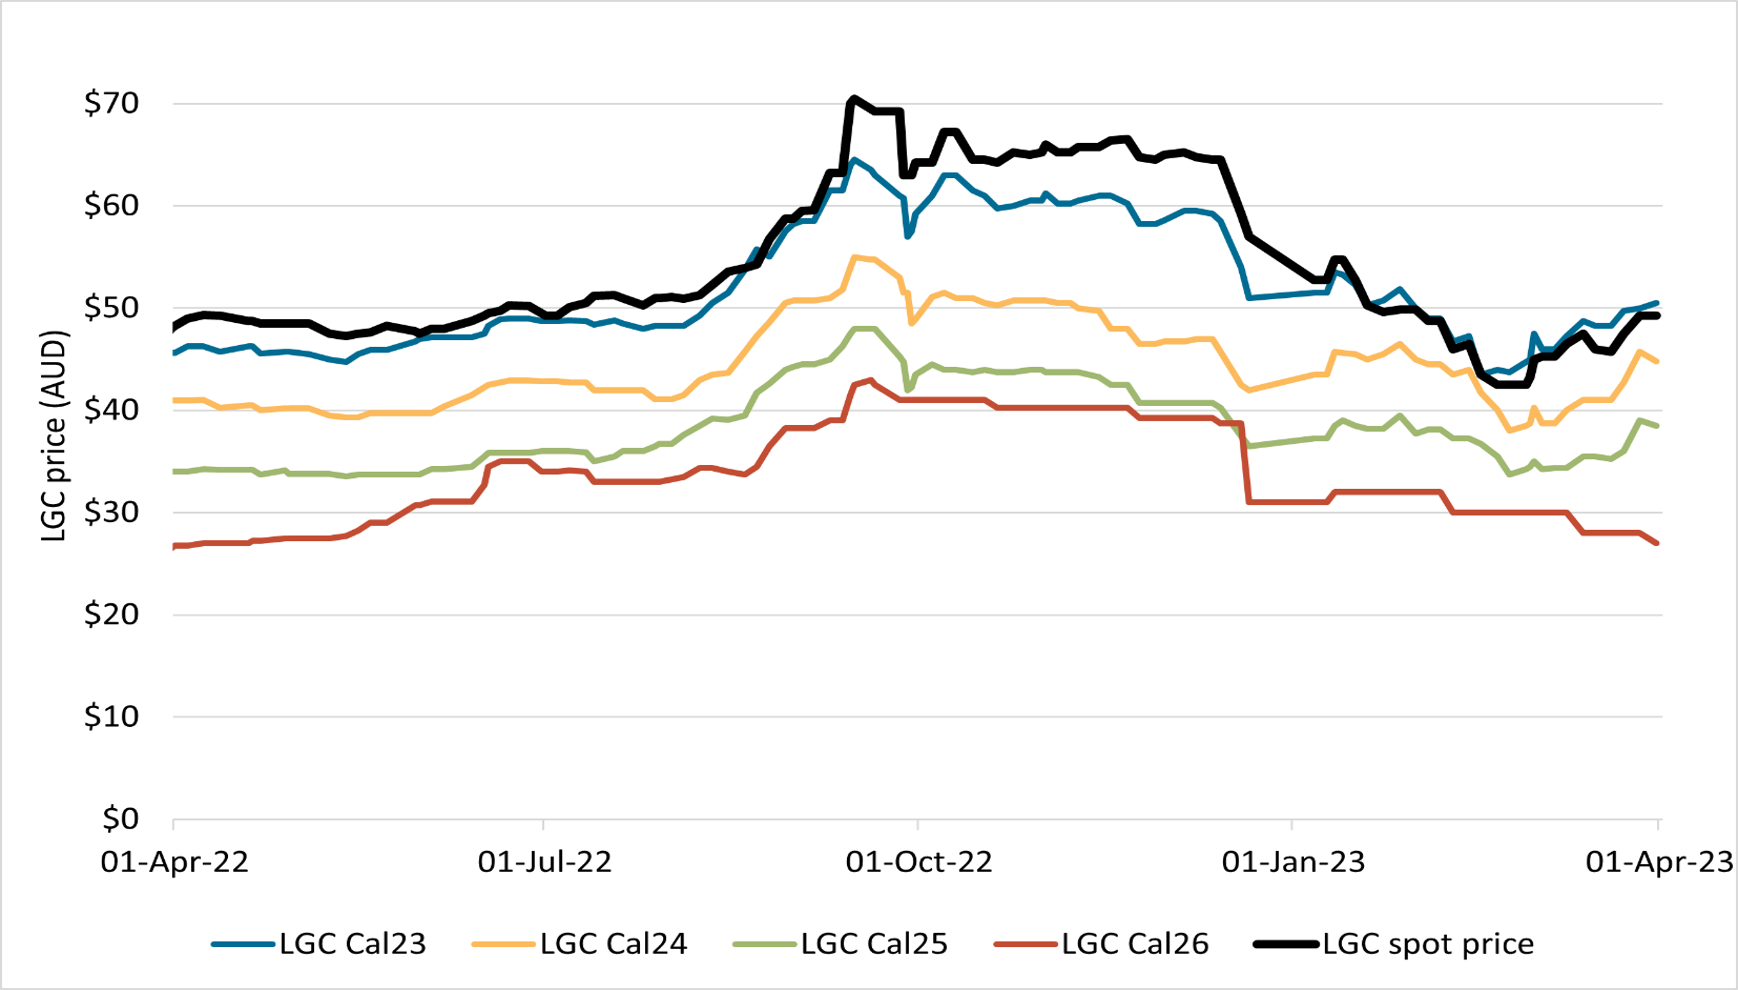
LGC spot prices fell 16% during Q1 2023 from $57 to $49.25 (see Figure 2.5), reaching a low of $42.50 on 20 February. Prices strengthened to about $52 by the end of April as industry worked through likely LGC supply/demand dynamics and the likely impact of proposed REGOs.
Cal23 to Cal25 forward prices generally follow the shape of spot prices. However, longer-dated forwards from Cal26 diverged. Cal26 and longer-dated prices may increase once the market fully considers the LGC supply and demand situation further out as discussed in the Q4 2022 QCMR.
Large-scale Generation Certificates (LGC) reported spot and forward prices
April 2022 to March 2023 Note: This figure is not interactive.
Description
This graph shows the LGC spot and forward prices over the last 12 months.
Small print
Pricing data is compiled from trades reported by CORE markets, and may not be comprehensive.
Footnotes
5 This is the existing generation capacity before the RET commenced that are not eligible for LGCs.