
On this page
- Market dynamics
- 2024 large-scale power station approvals
- Mid-scale solar projections out to 2030
- Final investment decisions step up expected to continue
- Growth in demand from entities making renewable energy claims
Market dynamics
In Q2 2024, renewable generation contributed 32% in the National Electricity Market (NEM). This is a 3-percentage point drop from Q2 2023. Renewable energy generation from wind and hydroelectricity power stations was lower than anticipated throughout Q2 2024. This was due to unfavourable wind conditions across April and May and a reduction in hydroelectricity due to dry conditions in Tasmania. However, renewable generation has increased in Q3 2024. We still expect renewable generation to average about 42% for the 2024 calendar year.
These suboptimal weather conditions were partially offset by an uptick in overall capacity as recently completed renewable power stations came online. Both rooftop and utility solar maintained their generation contribution at around 8% and 6%, respectively.
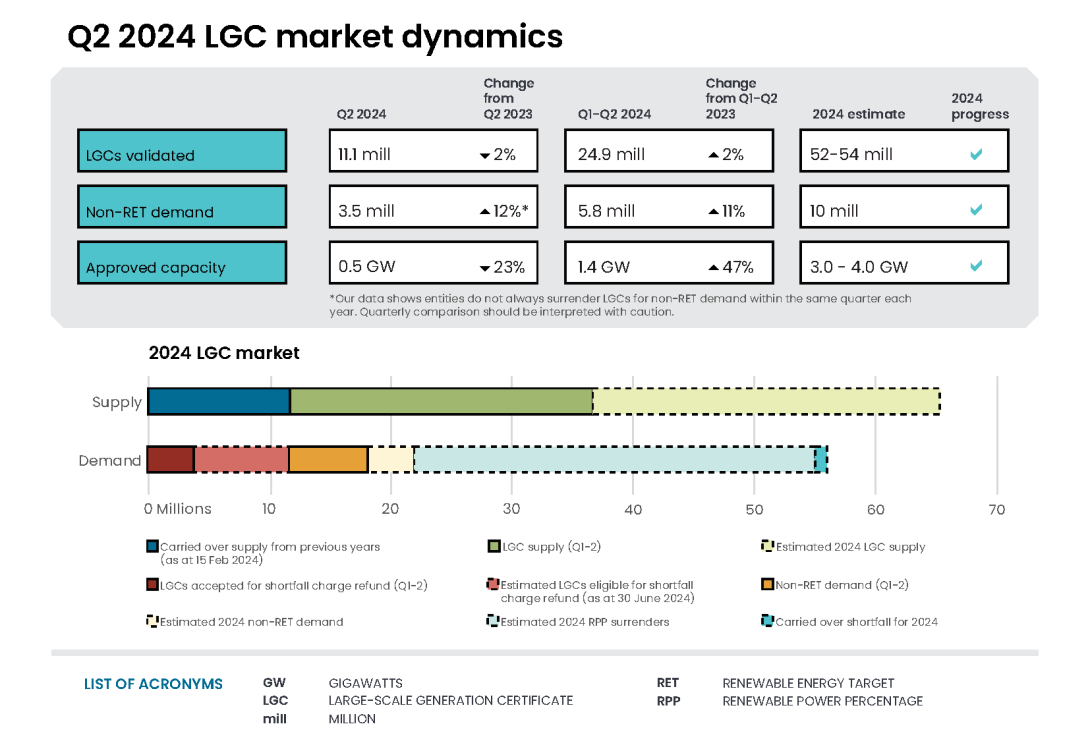
LGC supply in 2024 is steady with 24.9 million LGCs validated in the first half of 2024. Dependent on seasonal conditions, LGC supply remains on track for our annual estimate of 52-54 million LGCs.
Description
This figure shows the number of LGCs validated by technology type over time.
This figure is interactive. Hover over/tap each segment to see the number of LGCs. Click/tap on the items in the legend to hide/show data in the figure.
Small print
Waste coal mine gas is no longer eligible to create LGCs as of 2021. Validations in 2021 reflect LGCs that were created prior to 2021.
The LGC spot price softened slightly from $46.75 to $45.50 over Q2 2024. The spot price averaged $46.23 in Q2 2024. Future LGC prices for calendar years 2024 to 2026 fell in June 2024. However, the calendar year 2024 and 2025 forward prices remained at around $45.
Large-scale generation certificate (LGC) reported spot and forward prices
Note: This figure is not interactive.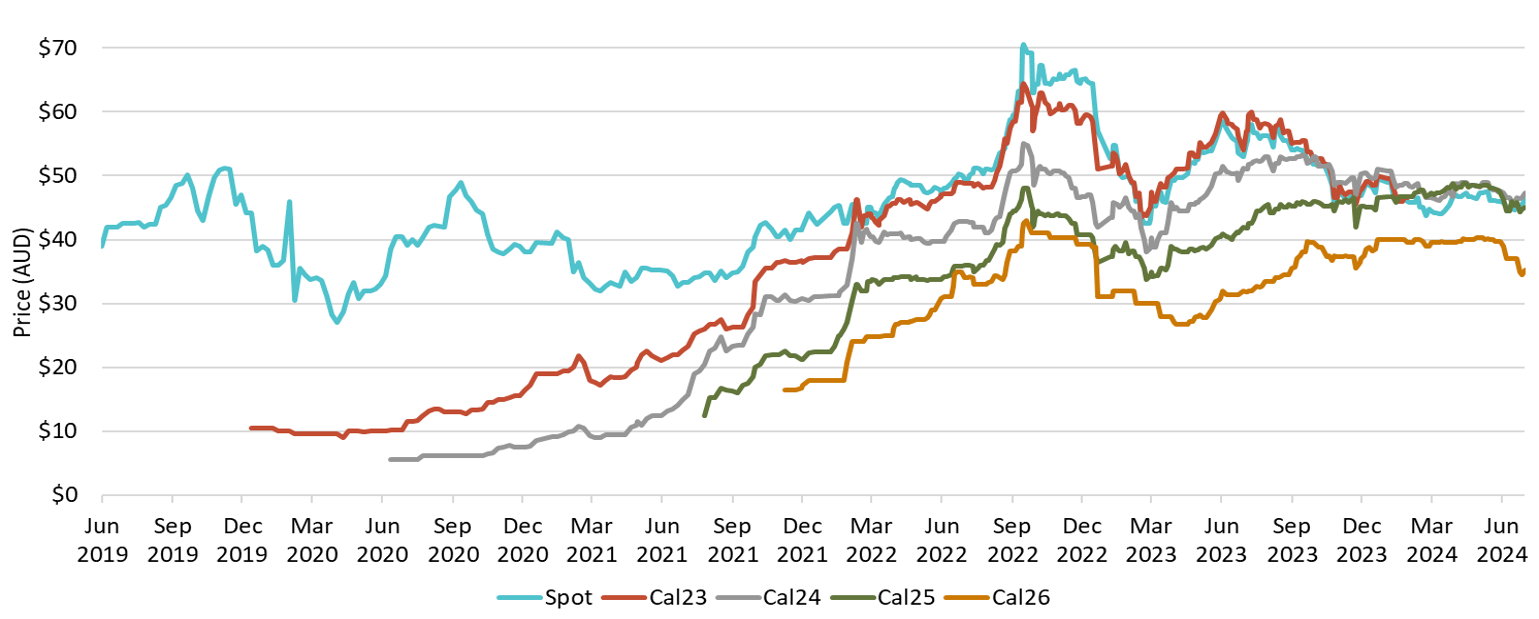
Description
This figure shows the daily closing LGC spot price and calendar year forward prices over time.
Small print
For example, Cal25 is the 2025 calendar year, where an agreement is made to buy/sell LGCs at a specified price in 2025. Pricing data is compiled from trades reported by CORE markets and may not be comprehensive.
2024 large-scale power station approvals
Power station approvals under the Large-scale Renewable Energy Target (LRET) remain high. In Q2 2024, 0.52 GW of capacity was approved. This marks the fifth consecutive quarter that over 0.5 GW of capacity has been approved.
Description
This figure shows the capacity of large-scale wind and solar power stations approved by the Clean Energy Regulator to generate large-scale generation certificates over time.
This figure is interactive. Hover over/tap each bar to see the capacity. Click/tap on the items in the legend to hide/show data in the figure.
Small print
Solar and wind hybrid projects are grouped under the solar category. Totals may not sum due to rounding.
MacIntyre Wind Farm (923 megawatts (MW)) and Golden Plains Wind Farm East (756 MW) could be approved to generate LGCs in 2024. They will be the two largest wind farms in Australia. These projects will contribute to a large jump in LGC supply once approved and reach full generation.
Mid-scale solar projections out to 2030
The CER’s outlook for mid-scale solar from 2024 to 2030 shows 200-300 MW of capacity will be installed each year. This is based on modelling conducted by consultants. Mid-scale solar is classified as rooftop solar or ground mount solar power stations ranging from 100 kilowatts (kW) to 30 MW. These are typically on commercial or industrial sites such as supermarkets, shopping centres, warehouses, and factories. At the end of Q2 2024, 240 MW of mid-scale solar had been installed and approved by the CER.
We undertake regular projections of expected mid-scale installed capacity. In 2024, we engaged ACIL Allen and Jacobs Australia to develop independent modelling. Since 2020, mid-scale projections have closely correlated with actual installed capacity. Annual installed capacity has averaged around 260 MW over the last five years.
Description
This figure shows the projected and actual installed capacity of mid-scale solar over time.
This figure is interactive. Hover over/tap along the lines to see the capacity. Click/tap on the items in the legend to hide/show data in the figure.
Small print
Mid-scale solar is classified as rooftop solar or ground mount solar power stations ranging from 100 kilowatts (kW) to 30 MW. The Clean Energy Regulator engages consultants to project installed capacity of mid-scale solar over time. A projection was not conducted by consultants in 2023.
While large-scale power stations under 1 MW are a smaller part of overall capacity, they represent a large proportion of installations. They are typically rooftop installations on commercial or industrial sites such as shopping centres, warehouses, and small businesses. In the first half of 2024, 243 (82 MW) solar power stations under 1 MW were approved by the CER. This is only marginally behind the 272 (88 MW) approved in total for this category in 2023.
Final investment decisions step up expected to continue
In the first half of 2024, 1.8 GW of capacity reached a final investment decision.
In Q2 2024, 1.0 GW of capacity reached a final investment decision. This included:
- Golden Plains Wind Farm – West (0.57 GW)
- Aldoga Solar Farm (0.38 GW)
- Quorn Park solar farm (0.08 GW).
An additional Q1 2024 project was identified in Q2 2024:
- St Ives Project, a 0.08 GW hybrid wind and solar farm.
Description
This figure shows the capacity and four quarter rolling average of large-scale renewable power stations to reach a final investment decision over time.
This figure is interactive. Hover over/tap each bar to see the capacity. Hover over/tap along the line to see the rolling average. Click/tap on the items in the legend to hide/show data in the figure.
Small print
The Clean Energy Regulator tracks public announcements. Data may be incomplete and may change retrospectively. Totals may not sum due to rounding.
Data as at 30 June 2024.
The Capacity Investment Scheme Tenders 1 and 2 are progressing. Tender 1 – NEM Generation received 40 GW of capacity bids. This is significantly higher than the 6 GW of renewable capacity targeted for the tender. Shortlisted projects will be invited to submit a financial value bid in August/September 2024. Project bids for Tender 2 – Wholesale Electricity Market (WEM) Dispatchable Capacity closed on 19 August 2024.
Growth in demand from entities making renewable energy claims
In Q2 2024, 3.5 million LGCs were cancelled for non-RET demand. This brings the total to 5.8 million LGCs cancelled for non-RET demand in the first half of 2024. We expect 10 million LGCs to be cancelled for non‑RET demand by the end of 2024.
Description
This figure shows non-RET LGC cancellations by demand source over time.
This figure is interactive. Hover over/tap each segment to see the number of LGCs. Click/tap on the items in the legend to hide/show data in the figure.
Small print
This classification system is uniform across Australian carbon credit unit (ACCU) and LGC cancellations.
Covered activities for each classification
Voluntary demand
Cancellations made against voluntary certification programs such as Climate Active and any sort of organisational emissions or energy targets.
Government demand
Cancellations by or on behalf of government entities. For example to offset emissions from vehicle fleets or meet voluntary emissions reduction targets.
Compliance demand
Cancellations made by private organisations and corporations for compliance or obligations against municipal, local, state and territory government laws, approvals, or contracts. For example to meet Environmental Protection Authority requirements.
In Q2 2024, non-RET demand came from many sources, such as:
- entities surrendering for the first time, including BHP Olympic Dam (cancelled 169,000 LGCs in Q2 2024) and BM Alliance Coal Operations (cancelled 218,000 LGCs in Q2 2024)
- educational institutions, including University of Melbourne (cancelled 53,000 LGCs in Q2 2024) and University of Sydney (cancelled 103,000 LGCs in Q2 2024)
- Corporate Emissions Reduction Transparency (CERT) report participants, including Dexus (cancelled 32,000 LGCs in Q2 2024) and Transurban (cancelled 48,000 LGCs in Q2 2024).
Supplementary figures
Description
This figure shows LGC holdings in Renewable Energy Certificate (REC) Registry accounts by market participation category over time.
This figure is interactive. Hover over/tap each data point to see the number of LGCs in millions. Click/tap on the items in the legend to hide/show data in the figure.
Small print
Holdings are for registered LGCs as at the end of the quarter and exclude any pending transactions. Accounts are categorised according to their primary role or function based on transaction patterns and the name of the account. An account's category is subject to change.
Category definitions
Liable entity
Account holder is a liable entity.
Power station
Account holder has created LGCs.
Non-RET (voluntary)
Account holder has surrendered LGCs voluntarily. This includes accounts labelled as 'GreenPower' in the REC registry.
Non-RET (compliance)
Account holder has surrendered LGCs voluntarily for non-RET compliance reasons (for example, desalination plants) or the account holder is a Safeguard entity or related to a Safeguard entity.
Non-RET (government)
Account holder has surrendered LGCs voluntarily and is a government entity.
Intermediary
Account holder has transacted/received over 1 million LGCs and does not fit into any of the other categories.
Other
Account holder does not fit into any of the other categories.
Large-scale generation certificate (LGC) spot price
Note: This figure is not interactive.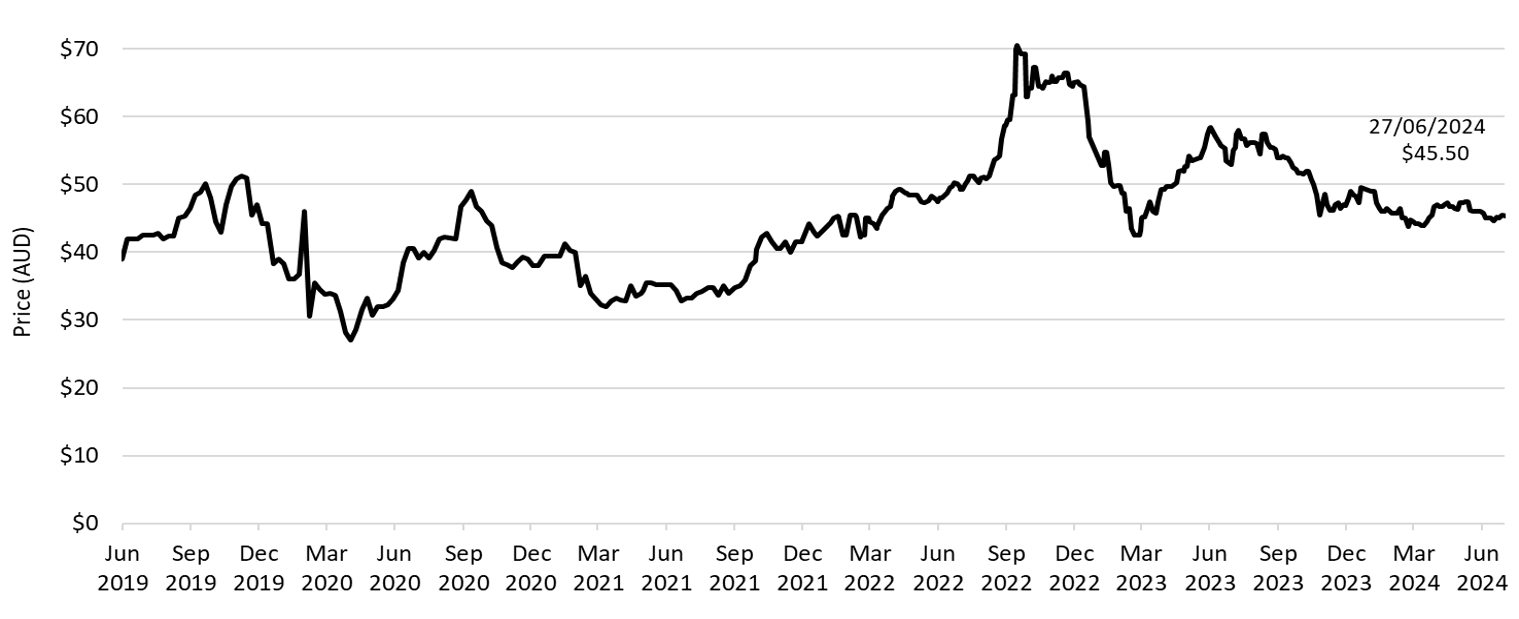
Description
This figure shows the daily closing LGC spot price over time.
Small print
Spot price data is compiled from trades reported by CORE markets and may not be comprehensive.
Description
This figure shows FID capacity over time. This figure also shows the potential revenue in Australian Dollars (AUD) per MWh for large-scale wind and utility solar generation over time.
This figure is interactive. Hover over/tap along the lines to see the capacity or the potential revenue. Click/tap on the items in the legend to hide/show data in the figure.
Small print
Potential revenue is calculated by adding the large-scale generation certificate (LGC) spot price and the National Electricity Market (NEM) wholesale price.
The Clean Energy Regulator tracks public FID announcements, this information may not be complete and may change retrospectively. NEM data sourced from OpenNEM. LGC spot price sourced from CORE markets.
Data as at 30 June 2024.