
On this page
- Market dynamics
- High rooftop solar system replacements in Queensland
- Battery installations continue to increase
- Air source heat pump installations lower in 2024
Market dynamics
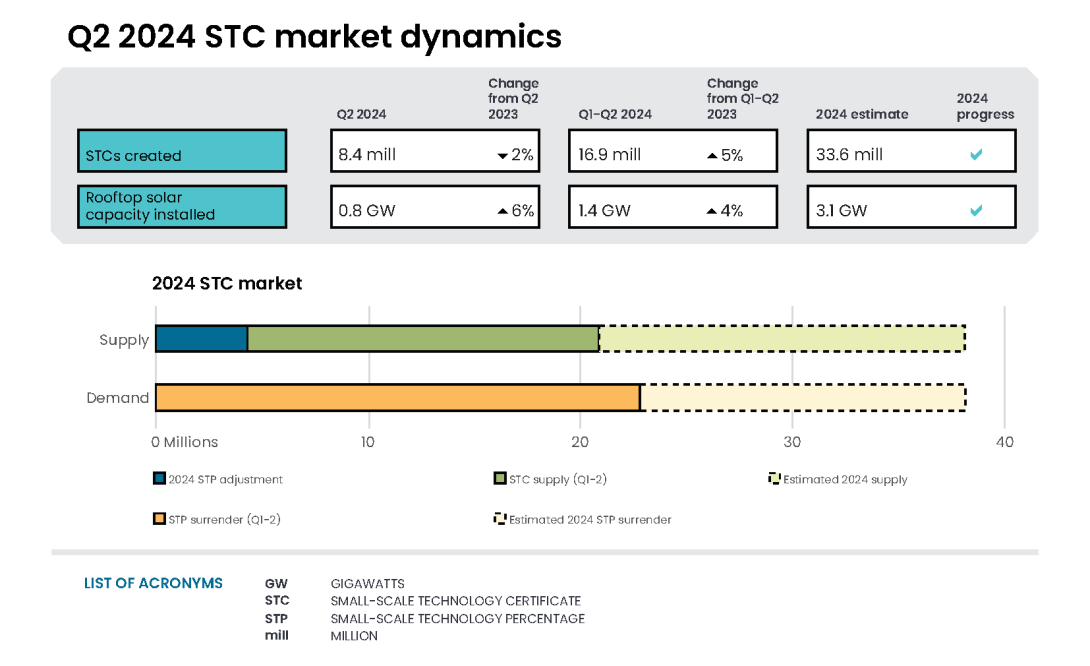
In Q2 2024, 8.4 million STCs were created, of which:
- 7.5 million STCs were from rooftop solar installations
- 0.9 million STCs were from solar water heater and air source heat pump installations.
Description
This figure shows the weekly supply of STCs in 2024. It also shows the required weekly supply of STCs (646,154) to meet the 2024 STP.
This figure is interactive. Hover over/tap each bar to see the number of STCs. Hover over/tap along the line to see the required weekly supply. Click/tap on the items in the legend to hide/show data in the figure.
Small print
Required STC supply refers to the estimated number of STCs to be created (33.6 million) to meet the annual STP liability and under/over supply from previous years. Some weeks are spread across multiple months, the month label refers to the month as at the end of the week.
To meet the 2024 small-scale technology percentage (STP) of 21.26%, liable entities must surrender 33.6 million STCs. The surrender for the Q2 2024 compliance period occurred on 29 July 2024. For the Q2 2024 compliance period, 9.5 million STCs were surrendered, a compliance rate of 100%. A total of 22.6 million STCs have been surrendered for the first 2 compliance periods of the 2024 STP.
Small-scale technology certificate (STC) reported spot and clearing house prices
Note: This figure is not interactive.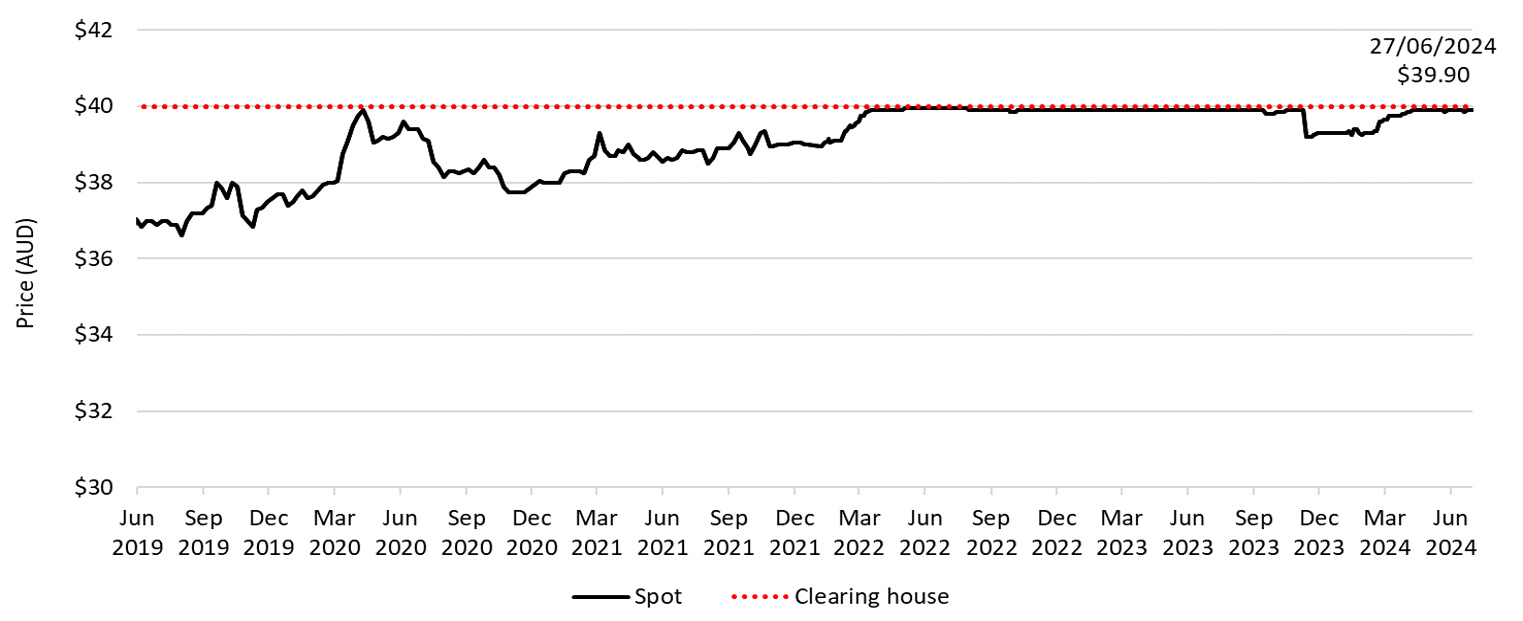
Description
This figure shows the daily closing STC spot price over time. It also shows the STC clearing house price.
Small print
Pricing data is complied from trades reported by CORE markets and may not be comprehensive.
Read more about buying and selling STCs, including through the clearing house.
The STC spot price fluctuated between $39.85 and $39.90 throughout Q2 2024. The STC spot price sat at $39.90 for most of the quarter, dropping to $39.85 on three occasions. These drops corresponded to periods the STC clearing house was in surplus. As previously discussed, the STC clearing house is expected to periodically be in and out of deficit over the Q2 and Q3 surrender periods.
Following the Q2 2024 compliance period surrender, the STC clearing house was in deficit of 3.1 million STCs.
High rooftop solar system replacements in Queensland
Rooftop solar installations in Queensland increased, in part due to a higher replacement rate. In Q2 2024, 30% of rooftop solar installations in Queensland were replacements compared to 19% nationally. In Q2 2024, 8% of all replacements in Queensland were in the cities of Gympie and Maryborough. These cities were affected by cyclones and hailstorms throughout late 2023 and early 2024.
Description
This figure shows small-scale rooftop solar replacements as a proportion of total installations by state and territory over time.
This figure is interactive. Click/tap along the lines to see the proportion. Click/tap on the items in the legend to hide/show data in the figure.
Small print
Replacements represent small-scale rooftop solar systems categorised in the Renewable Energy Certificate (REC) Registry as replacements. The installation type data field was added to the REC Registry in late 2020. Data as at 30 June 2024 and has not been lag-adjusted. Data is subject to change due to the 12 month creation rule.
Battery installations continue to increase
Generally, more rooftop solar systems are being installed with a battery. In Q2 2024, 10% of rooftop solar systems were installed with a battery compared to 8% in Q2 2023. Noting, this is voluntarily reported to the CER and the actual numbers are likely higher. In May 2024, the NSW Government announced a new subsidy for households installing batteries with either a new or pre-existing solar system.
Air source heat pump installations lower in 2024
In Q2 2024, 21,000 air source heat pump installation applications were processed for STC creation.
Since Q4 2023, the majority (67%) of air source heat pumps installed in Victoria have replaced a gas water heater. This is driven by a combination of higher existing gas usage and rising gas prices combined with state-based financial incentives. While the majority (66%) of air source heat pumps installed in the rest of Australia since Q4 2023 replaced an electric water heater.
Some state and territory incentives have tightened eligibility of some hot water installations. This includes the Energy Savings Scheme in NSW. Air source heat pump installations are likely to remain lower in the second half of 2024 when compared with 2023.
Supplementary figures
Description
This figure shows the number of air source heat pump installations under the Small-scale Renewable Energy Scheme (SRES) by state and territory over time. It also shows the number of STCs validated from these installations over time.
This figure is interactive. Hover over/tap each segment to see the number of installations. Hover over/tap along the line to see the number of STC validations. Click/tap on the items in the legend to hide/show data in the figure.
Small print
Where cell values are less than 10 data have been modified due to privacy considerations. In the figure these values appear as 10.
A 12 month creation period for registered persons to create small-scale technology certificates (STCs) applies under the Renewable Energy (Electricity) Regulations (2001). STC validation data has been rounded to the nearest thousand. Data as at 30 June 2024 and has not been lag-adjusted. Data is subject to change.
Description
This figure shows the installed capacity and the number of small-scale rooftop solar installations over time.
This figure is interactive. Hover over/tap each bar to see the installed capacity. Hover over/tap along the line to see the number of installations. Click/tap on the items in the legend to hide/show data in the figure.
Small print
Small-scale rooftop solar systems must have a capacity of less than 100 kilowatts (kW). A 12 month creation period for registered persons to create small-scale technology certificates applies under the Renewable Energy (Electricity) Regulations (2001). Data for installations and installed capacity in 2023 and 2024 have been lag-adjusted to account for the 12 month creation rule and are estimates only. Data is subject to change.
Description
This figure shows the rooftop solar capacity installed under the Small-scale Renewable Energy Scheme (SRES) by state and territory over time.
This figure is interactive. Hover over/tap along the lines to see the capacity. Click/tap on the items in the legend to hide/show data in the figure.
Small print
A 12 month creation period for registered persons to create small-scale technology certificates applies under the Renewable Energy (Electricity) Regulations (2001). Data for installations in 2023 and 2024 have been lag-adjusted to account for the 12 month creation rule and are estimates only. Data is subject to change.
Description
This figure shows the proportion of rooftop solar systems installed under the Small-scale Renewable Energy Scheme (SRES) by capacity band over time.
This figure is interactive. Hover over/tap each segment to see the proportion. Click/tap on the items in the legend to hide/show data in the figure.
Small print
A 12 month creation period for registered persons to create small-scale technology certificates applies under the Renewable Energy (Electricity) Regulations (2001). Data as at 30 June 2024 and has not been lag-adjusted. Data is subject to change. Totals may not sum to 100% due to rounding.
Description
This figure shows the small-scale rooftop solar average system size over time.
This figure is interactive. Click/tap along the line to see the average system size.
Small print
Small-scale rooftop solar systems must have a capacity of less than 100 kW. A 12 month creation period for registered persons to create small-scale technology certificates applies under the Renewable Energy (Electricity) Regulations (2001). Data for average system size in 2023 and 2024 have been lag-adjusted to account for the 12 month creation rule and are estimates only. Data is subject to change.
Description
This figure shows the volume of STCs transacted and the number of transactions, excluding STC clearing house transactions, over time.
This figure is interactive. Hover over/tap each bar to see the number of STCs. Hover over/tap along the line to see the number of transactions. Click/tap on the items in the legend to hide/show data in the figure.
Description
This figure shows STC supply over time.
This figure is interactive. Hover over/tap each bar to see the number of STCs.