
How an irrigated cotton project is set up and run is critical for calculating the amount of emissions produced as a result of a project, which in turn determines the amount of abatement that has occurred and how many ACCUs may be issued for a project. Parts 3 and 4 of the method and explanatory statement describe in detail how to set up a project and how to calculate the volume of emissions avoided, as well as the net abatement that has occurred.
Setting up and running an irrigated cotton project can be divided into the following parts. To explain the project in more detail, each part refers to the relevant sections of the method and explanatory statement.
Establish the project area
An irrigated cotton project area can be part of a farm, or a whole farm (Section 12). A project can also be made up of multiple farms, but it is recommended that each farm is identified as a separate project area, to make your record keeping easier.
Within a project area, the area of land on which cotton is planted and irrigated is known as the cotton area. Each project area must only have one cotton area for each reporting period.
The cotton area can change from year to year if required, due to factors such as water availability and rotational cropping. However, the total area must remain the same over time, and it must not include land containing residue from burning after harvest during the reporting period.
Stratify the cotton area
Each cotton area must be made up of one or more fields (Section 13). The stratification of the cotton area into fields is used to verify the yield of cotton from each field. This information is then used to calculate the project’s net abatement in greenhouse gas emissions.
Fields do not need to be adjacent, and can be spread out within the cotton area.
Each field must be given a unique identifier. The cotton area (and therefore the fields) within a project area, is likely to change from year to year, depending on water availability and crop rotation. A new field identifier must be used each time a field’s perimeter changes.
A map of the fields making up your cotton area must be provided in any report to the Clean Energy Regulator. Maps must be in digital GIS format (Section 14). To generate maps, you can use the Carbon Farming Mapping Tool, or any other tool that meets the standards required by the CFI Act.
Manage your project
While running your project, you must implement management actions to increase nitrogen fertiliser use efficiency (Sections 9 and 10 in the method). The main ways to do this are to either increase lint yield without a proportional increase in the amount of synthetic fertiliser nitrogen applied, or reduce the amount of synthetic fertiliser nitrogen applied without a proportional decrease in lint yield.
Management actions are varied and flexible, meaning you can choose those that best suit your project. Any management actions you choose must meet the standards given in Section 10 of the method. They must also be consistent with the relevant myBMP (Best Management Practice) standard published by the Cotton Research and Development Corporation.
Some examples of management actions include:
- changing the type of nitrogen fertiliser
- changing the rate, timing or placement of nitrogen fertiliser application
- improving drainage, or
- growing different crop varieties to increase yield.
You must carry out at least one new management action each time the project has a cotton area, but you can implement as many actions as you want (Section 9). The new management actions must differ from historic management actions (i.e. what you did before starting the project). Table 1 in the explanatory statement gives examples of new management actions and explains how to describe them in your project application.
Management actions can also occur in the year before planting your cotton crop. For example, you could plant legume crops to increase levels of soil nitrogen before planting the cotton.
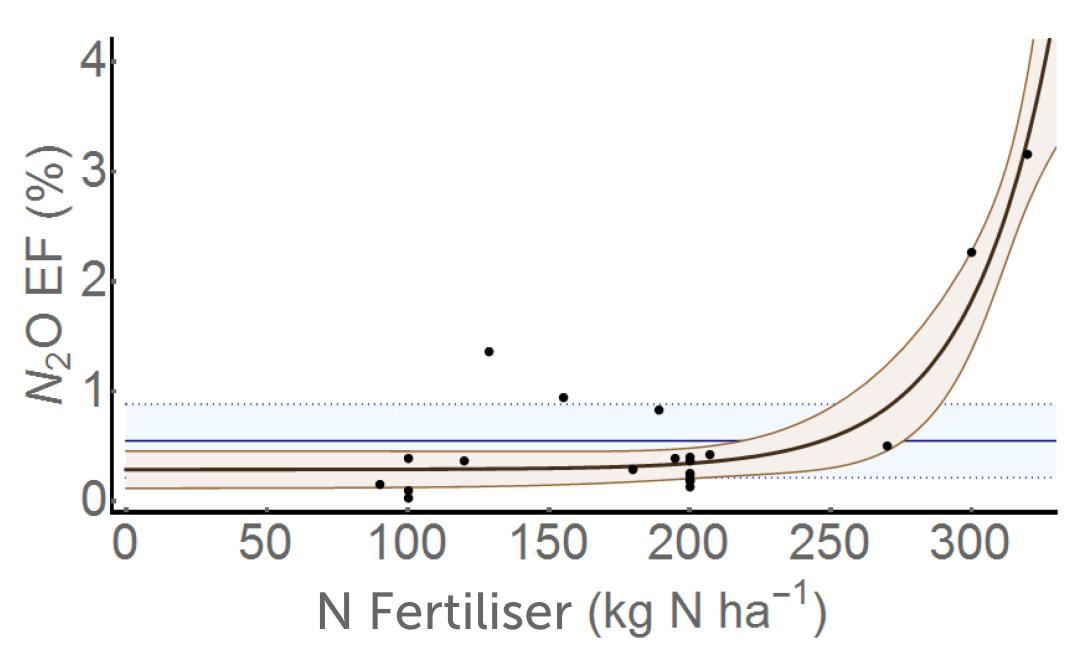
Cotton growers who currently apply fertiliser at high rates have the greatest potential to reduce emissions by running an irrigated cotton project. In the Australian cotton industry, the average rate of nitrogen fertiliser use is about 243 kilograms of nitrogen per hectare. Figure 1 shows that at levels above about 250 kilograms of nitrogen per hectare, the amount of emissions increases in an exponential manner. Heavy users of fertilisers would therefore only need to moderately reduce their nitrogen fertiliser use to achieve good levels of abatement.
Figure 1. Above about 250 kilograms of nitrogen fertiliser applied per hectare, the emissions of nitrous oxide (N20) rise exponentially. N20 is a potent greenhouse gas with 298 times the global warming potential of CO2. So, reducing N20 emissions by even a small amount can have a big impact on the levels of abatement a project can achieve. Note: EF = emissions factor, which is equivalent to emissions. Source Fertilisers in irrigated cotton: final equations.
Calculate baseline emissions
The baseline represents what would happen if your project did not occur. It provides a point against which any changes in the amount of emissions generated by a project in a reporting period are measured. For irrigated cotton projects, the baseline emissions are calculated using the Irrigated Cotton Calculator (Section 20). Instructions for using the calculator, which is in a Microsoft Excel spreadsheet, can be found on the first page of the calculator. Fertiliser in irrigated cotton: final equations is a guide describing all the equations used by the calculator.
Baseline emissions are determined during a set period of time known as the emissions intensity reference period. To work out the baseline emissions, first calculate the emissions intensity of both synthetic nitrogen fertiliser use and green manure residue incorporation.
Emissions intensity is a measure of the amount of greenhouse gas emissions released for each kilogram of cotton lint produced. It is measured in tonnes of CO2-e per kilogram of lint yield. As the efficiency of nitrogen fertiliser use is improved, the emissions intensity of nitrogen fertiliser use is decreased.
Once you have calculated the emissions intensity of synthetic nitrogen fertiliser and green manure in the emissions intensity reference period, the result is multiplied by the lint yield (in tonnes) in each year of the reporting period. This gives you the baseline emissions for your project. Section 17 of the method and explanatory statement explain how to do this.
The last step in calculating baseline emissions is to apply a variance discount (Section 18). The variance discount is 6.5 per cent of total baseline emissions. It is automatically applied in the Irrigated Cotton Calculator. This discount is applied to take into account natural variation in environmental conditions that could affect your nitrogen fertiliser use efficiency (and therefore emissions intensity). Examples include weather conditions such as too much or too little rainfall, or changes in temperature.
Emissions intensity reference period
Data about previous cotton and green manure crops from the emissions intensity reference period is used to calculate the baseline emission intensity for your project (Section 11).
The default reference period covers the six years before the first day of your project’s crediting period. The baseline emissions intensity is calculated for each year that cotton was grown in the emissions intensity reference period. Although the method states that you may not burn crop residue during the project, you will still be eligible even if you burned residue in the emissions intensity reference period.
Within the emissions intensity reference period, at least three years of cotton crop data must be included to calculate a reasonable estimate of emissions (Sections 23–28). For any one year to count as a reference year, the lint yield for that year must not be zero. If data for at least three years is not available within the six year period, then the reference period can be extended, one year at a time, until three years’ worth of data can be obtained. The maximum time allowed is nine years.
For example, if 2015 is the year your crediting period begins, the emissions intensity reference period is the six years before this date (2009 to 2014). You only have all the required cotton crop data for 2007, 2010 and 2012. You can extend the reference period back by two years to 2007, giving you a reference period of eight years, because this falls into the maximum allowable time of nine years.
Green manure emission
To reduce the use and cost of nitrogen fertilisers, you can grow a green manure crop, such as legumes. Bacteria in the root nodules of these plants naturally produce nitrogen, thereby improving the nitrogen levels of the soil.
The green manure crops still produce emissions of nitrous oxide (N2O). However, only the emissions from the above ground parts of the green manure crop (stems and leaves) are accounted for by this method. The emissions from the underground parts of the plant (roots and nodules) are not required to be accounted for.
As a result, growing a green manure crop accounts for less emissions than if you had instead used extra nitrogen fertiliser instead. The method only requires you to account for emissions from the green manure crop grown in the cotton area immediately before the cotton crop (Section 16). Green manure crops grown before any other crop are not taken into account.
Calculate emissions from the project
Every project needs to take into account emissions that arise from running it (Section 19). This is to ensure these emissions are included in calculations that determine net CO2-e abatement for a reporting period and crediting period.
The emissions are calculated using the Irrigated Cotton Calculator for each year of the reporting period. The gases that are accounted for in the emissions calculations are described in Section 16 of the method.
The sources of emissions accounted for in the method are:
- synthetic nitrogen fertiliser and urea (a nitrogen fertiliser that contains carbon) applied to the cotton area
- green manure residues from crops planted on the cotton area immediately before the cotton crop.
The emissions from these sources can be either direct or indirect. The emissions for each year in the reporting period in a project area are added together to reach the total emissions for the project.
Direct and indirect emission sources
Direct emissions are a result of nitrogen fertiliser application and green manure residue. They are the result of a chemical process called denitrification. Denitrification is the loss of oxygen (O) from nitrate (NO3−), resulting in nitrous oxide (N2O). This is released directly into the air. N2O is described as a potent greenhouse gas, because it has 298 times the global warming potential of carbon dioxide (CO2). In other words, emitting one kilogram of N2O has the same effect on the atmosphere as emitting 298 kilograms of CO2.
The use of urea can also contribute to direct CO2 emissions when it dissolves in the soil.
Indirect N2O emissions from synthetic nitrogen fertiliser and green manure occur from leaching through the soil into waterways, and runoff over the soil surface. They also occur when fertiliser is converted into ammonia (NH3) gas by the process of volatilisation (a solid turning directly into a gas), followed by redeposition onto land and water as solid NH3 or ammonium (NH4+).
Calculate the net amount of abatement and number of ACCUs
This is the final step in the calculations to determine the number of ACCUs that may be issued for a reporting period. At this stage the total emissions from the project area are calculated and then converted to tonnes of carbon dioxide equivalents (tCO2-e).
The Irrigated Cotton Calculator will automatically calculate the net abatement amount for the reporting period once you have entered the required data. The calculator uses the following inputs (Section 20):
- region of the project area
- nitrogen fertiliser amount and concentration
- area of cotton and green manure planted
- cotton lint yield.
The calculator determines the net abatement by subtracting the project emissions from the baseline emissions over the reporting period (Section 15).
What’s CO2-e?
CO2-e is a measure of the warming effect of different greenhouse gases that allows them to be compared to the equivalent amount of carbon dioxide. It refers to the amount of carbon dioxide that would give the same warming effect as each greenhouse gas that is emitted or stored by an activity.