In calculating abatement for your aggregated small energy users project, you are bound by the choices you made before selecting control and treatment groups. For example, if you chose to use sub-method one for a population, you must calculate abatement for that population using sub-method one throughout the project.
You can use pro-rata energy consumption data for a measurement period if:
- the electricity or gas meter readings for particular sites or populations do not fall on the start or end days of the measurement periods (see section 34), and
- a site is affected by attrition and you have access to energy consumption data for part of a measurement period only.
Other than sites affected by attrition, you must use all the sites you selected for the control and treatment group to calculate abatement. If a site is missed when you deliver goods or services as part of the activity, or if the small energy user opts out of receiving the goods and services, the site’s energy consumption must still be used in the calculation of treatment group emissions.
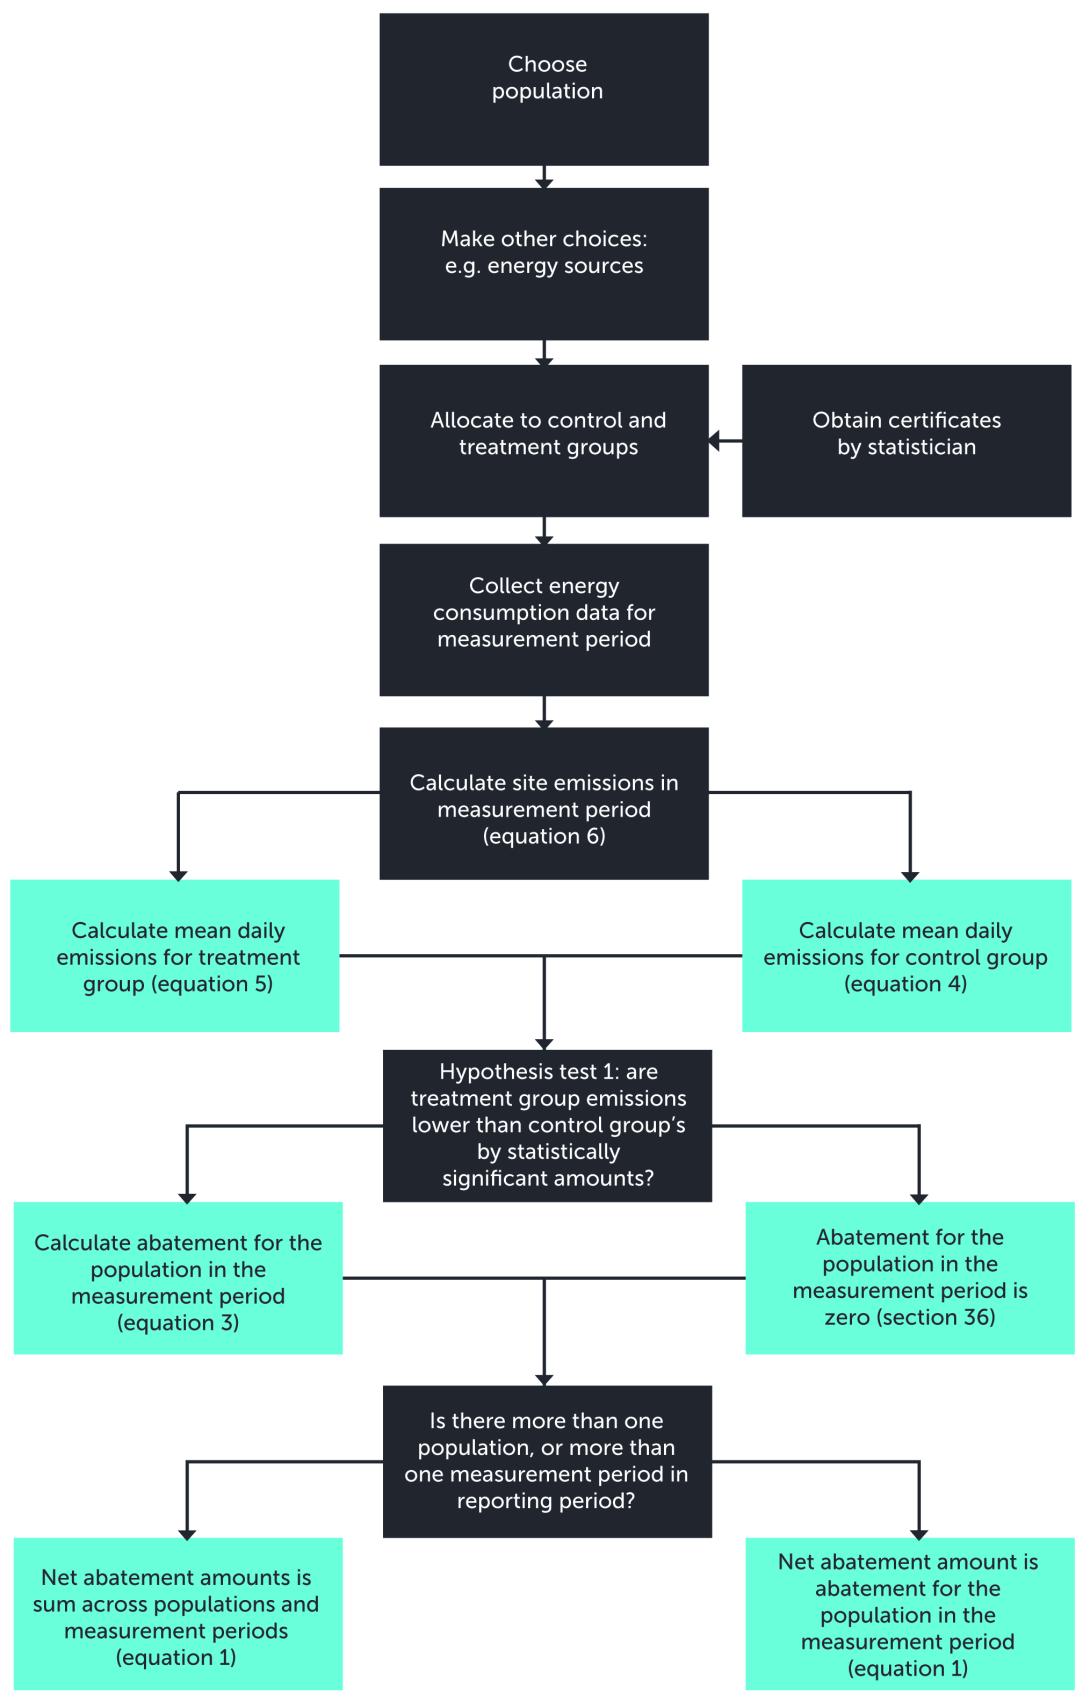
Calculating abatement—sub-method one
Use the following steps:
- Calculate emissions for each site in the control and treatment group during the measurement period. This is done by multiplying energy consumption during the period by the relevant emissions factors (section 45).
- Calculate mean daily emissions for each site in the control group and the treatment group (sections 43 and 44 respectively).
- Test whether the difference between the control and treatment groups is significant (section 40): the mean daily emissions from the treatment group should be significantly lower than those from the control group.
If the treatment group’s emissions are statistically significantly lower than those of the control group, calculate abatement for the population using the equation in section 42.
If the treatment group’s emissions are not found to be significantly lower than those of the control group—so you cannot reject the null hypothesis—abatement for that population in the measurement period is calculated to be zero (see the table in section 38).
Calculating abatement—sub-method two
Use the following steps:
- Calculate emissions for each site in the control and treatment group during both the measurement period and the pre-treatment period. This is done by multiplying energy consumption during the period by the relevant emissions factors (sections 53 and 54).
- For each site, find the change in emissions between the pre-treatment period and the measurement period, adjusting for any difference in the number of days in each period covered by energy consumption data (section 52).
- Calculate the mean daily change in site emissions between the pre-treatment period and measurement period for both the control group (section 50) and the treatment group (section 51).
- Test whether the change in emissions for the treatment group is lower than the change in emissions for the control group by a statistically significant amount (section 47).
The change in treatment group emissions is lower than the change in control group emissions if:
- the treatment group’s emissions have increased over time by a smaller amount than the control group’s emissions have increased, or
- the treatment group’s emissions have decreased over time by more than the control group’s emissions have decreased.
For example in a population where the business-as-usual trend results in emissions decreasing over time in both the treatment and control group, the change in pre and post treatment emissions will be a negative number for both groups. If the treatment has been effective the size of the change in the treatment group will be a smaller negative number (and a larger in absolute number).
If the difference between the control and treatment group is found to be statistically significant, calculate abatement using the equations in section 49.
If the change in the treatment group’s emissions is not lower than the control group’s emissions by a statistically significant amount—so you cannot reject the null hypothesis—abatement for that population in the measurement period is calculated to be zero (see the table in section 38).
Calculating abatement—sub-method three
Use the following steps:
- Calculate emissions for each site in the control and treatment group during both the measurement period and the pre-treatment period. This is done by multiplying energy consumption during the period by the relevant emissions factors (sections 61 and 62).
- Calculate mean daily emissions for each site for both the pre-treatment and measurement periods (sections 60 and 59 respectively).
You must then create a data set containing one entry for each site in the control or treatment group, with results for the site against the following variables:
- mean daily emissions at the site in the measurement period (section 59)
- a treatment variable with the value of zero (for a site in the control group) or one (for a site in the treatment group)
- mean daily emissions at the site in the pre-treatment period (section 60)
- variables to capture the effect of attrition on mean daily emissions at the site, which take the value zero (the site was affected by attrition) or one (the site was not affected by attrition) during the relevant time period (this is optional), or
- other variables that may influence consumption of grid electricity or gas at the site (optional).
Define a linear equation relating mean daily emissions at a site in the measurement period (the dependent variable) to the variables listed above (section 58).
Use linear regression, weighted by the number of days for which measured energy consumption data is used for the site in the measurement period, to calculate the value of the ‘treatment variable’. This lets you determine the effect of the treatment variable on emissions in the treatment group; it will be negative if emissions have declined compared to the control group.
Test the statistical significance of the effect of the treatment variable (section 56):
- If the treatment variable is less than zero by a statistically significant amount, calculate abatement using the equations in section 57.
- If the treatment variable is not less than zero by a statistically significant amount—so you cannot reject the null hypothesis—abatement is set to zero (see the table in section 38).
Calculating the net amount of abatement and number of ACCUs
This is the final step in the calculations to determine the number of ACCUs that may be issued for a reporting period.
You may include more than one population in a project, and may choose to include two one-year measurement periods in a reporting period. If this is the case, the net abatement amount for the reporting period is found by adding abatement calculated for individual populations and measurement periods.
Calculating abatement for multiple populations in a single reporting period will require you to align the measurement periods for your populations. Alternatively, if the metering cycle for a whole population is different from the measurement periods that you are using for another population, you have the option of reporting the two populations separately as if they were separate projects (see part six).
This figure on the next page shows the sequence of decisions and calculations involved in an aggregated small energy users project. This example uses sub-method one to calculate the net abatement amount for the first reporting period for a project.
Figure one: Process to calculate net amount of abatement