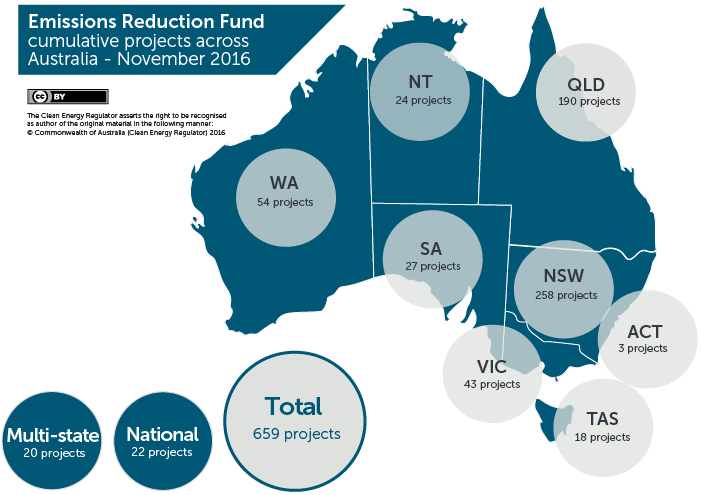
This map shows the cumulative total number of Emissions Reduction Fund projects registered in each state and territory across Australia, as at 30 November 2016. The below data does not include information on revoked projects. Data from revoked projects is available in the Emissions Reduction Fund project register.
Click on the image to open a high resolution version.

This map shows the cumulative total number of Emissions Reduction Fund projects registered in each state and territory across Australia, as at 30 November 2016.
Emissions Reduction Fund registered projects across Australia
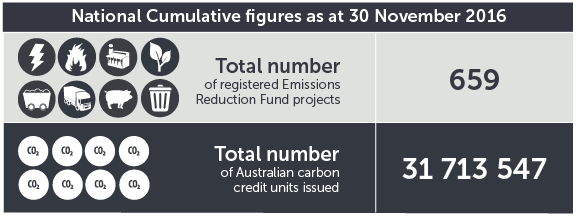
This graphic shows the total number of registered projects under the Emissions Reduction Fund, and the total number of Australian carbon credit units issued under the scheme, as at 30 November 2016.
Click on the image to open a high resolution version.
Carbon abatement contracts
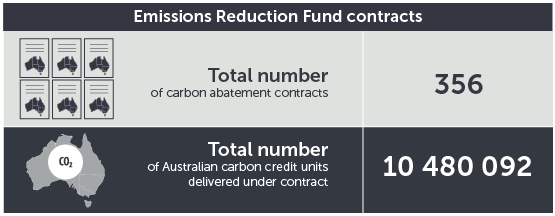
This graphic shows the total number of carbon abatement contracts awarded under the Emissions Reduction Fund and the total number of Australian carbon credit units delivered under contract, as at 30 November 2016.
Click on the image to open a high resolution version.
Cumulative registered projects by method type
This table shows the national cumulative total of projects registered under the Emissions Reduction Fund as at 30 November 2016, broken down by method type.
Click on the image to open a high resolution version.
Types of projects in each state and territory
These tables show the cumulative total of registered project types in each state and territory, as at 30 November 2016.
Click on the images to open a high resolution version.
- Multi-state projects are those with sites in more than one state or territory
- Nationwide projects are those with sites in all states and territories.


