
For this publication, greenhouse and energy data reported under the National Greenhouse and Energy Reporting scheme has been grouped according to the Australian and New Zealand Standard Industrial Classification (ANZSIC) subdivision, which is a system that was developed for use in both countries for the production and analysis of industry statistics.
It is a legislative requirement that, except when expressly permitted, individual reporters cannot be identified when National Greenhouse and Energy Reporting scheme data is published. Where an ANZSIC subdivision has too few facilities represented, the aggregated data is not included in the table below. Instead this data is collectively included in a separate line item.
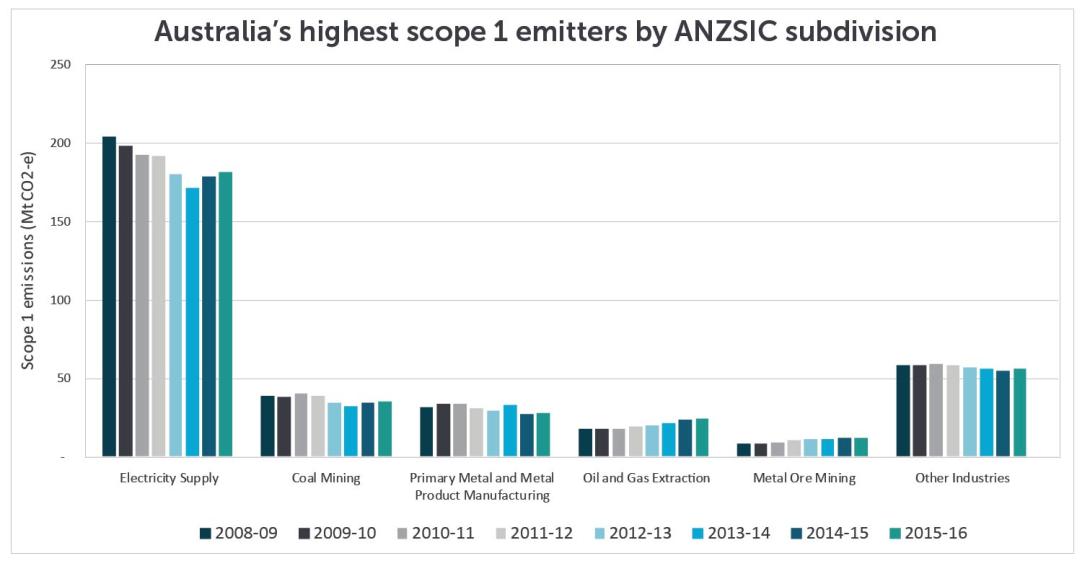
Australia's emissions according to industry (ANZSIC subdivisions)
Each individual reporter assigns the ANZSIC code for each facility reported based on its predominant activity. ANZSIC codes are broken up into divisions, subdivisions, classes and subclasses. Information has been presented at the ANZSIC subdivision level.
The five ANZSIC subdivisions with the most emissions have stayed the same since the 2012-13 National Greenhouse and Energy Reporting scheme reporting year. The top five subdivisions are electricity supply, coal mining, primary metal and metal product manufacturing, oil and gas extraction and metal ore mining. Electricity supply is the subdivision that reports the most scope 1 emissions.
The data in this publication has undergone a quality assurance process and adjustments to reported ANZSIC subdivisions have been made where appropriate.
As ANZSIC codes are self-reported, the Clean Energy Regulator cannot guarantee the accuracy of the codes chosen by reporters although efforts have been made to identify any significant errors.
Where a Vertically Integrated Production Process (VIPP) has been reported, emissions from this report have been allocated to the appropriate industry.
Some data has been withheld in some categories to ensure anonymity of reporters which is required under the legislation.
This chart and dataset reflect changes in the global warming potential factors for carbon dioxide equivalent emissions that came into effect in the 2015-16 reporting year.
| Manufacturing subdivision | 2008-09 | 2009-10 | 2010-11 | 2011-12 | 2012-13 |
|---|---|---|---|---|---|
| Electricity Supply | 203,083,134 | 197,297,688 | 191,955,178 | 190,087,726 | 178,959,159 |
| Coal Mining | 33,414,449 | 32,921,457 | 34,607,064 | 33,419,154 | 29,908,562 |
| Primary Metal and Metal Product Manufacturing | 30,943,538 | 32,964,278 | 33,479,595 | 30,143,484 | 29,021,460 |
| Oil and Gas Extraction | 16,865,334 | 17,408,685 | 17,372,573 | 18,056,585 | 19,531,508 |
| Metal Ore Mining | 8,140,183 | 8,224,419 | 8,857,919 | 9,828,238 | 10,553,885 |
| Other industries | 56,923,555 | 57,272,688 | 58,025,714 | 57,041,402 | 55,621,947 |
Australia's scope 1 emissions by ANZSIC subdivision for NGER
For detailed information on the dataset for Australia's scope 1 emissions by ANZSIC subdivision for the entire reporting history of National Greenhouse and Energy Reporting download the excel spreadsheet. For a subset of this data see the below table.
Australia's scope 1 emissions by ANZSIC subdivision for NGER Reporters
| ANZSIC Code | ANZSIC Subdivision | 2015-16 Scope 1 emissions (tCO2-e) | 2015-16 Number of facilities |
|---|---|---|---|
| 44 | Accommodation | 46,240 | 123 |
| 72 | Administrative Services | 47,710 | 216 |
| 82 | Adult, Community and Other Education | 1,036 | 14 |
| 01 | Agriculture | 134,756 | 241 |
| 05 | Agriculture, Forestry and Fishing Support Services | 57,708 | 32 |
| 49 | Air and Space Transport | 7,626,846 | 146 |
| 02 | Aquaculture | withheld | withheld |
| 64 | Auxiliary Finance and Insurance Services | withheld | withheld |
| 18 | Basic Chemical and Chemical Product Manufacturing | 9,140,579 | 235 |
| 33 | Basic Material Wholesaling | 130,824 | 221 |
| 12 | Beverage and Tobacco Product Manufacturing | 155,522 | 75 |
| 56 | Broadcasting (except Internet) | 5,076 | 23 |
| 73 | Building Cleaning, Pest Control and Other Support Services | 23,050 | 80 |
| 30 | Building Construction | 25,198 | 89 |
| 06 | Coal Mining | 34,450,013 | 168 |
| 70 | Computer System Design and Related Services | 293 | 18 |
| 32 | Construction Services | 592,574 | 53 |
| 90 | Creative and Performing Arts Activities | withheld | withheld |
| 76 | Defence | withheld | withheld |
| 26 | Electricity Supply | 181,168,071 | 426 |
| 10 | Exploration and Other Mining Support Services | 226,928 | 181 |
| 22 | Fabricated Metal Product Manufacturing | 72,686 | 88 |
| 62 | Finance | 33,784 | 70 |
| 04 | Fishing, Hunting and Trapping | withheld | withheld |
| 45 | Food and Beverage Services | 45,932 | 58 |
| 11 | Food Product Manufacturing | 2,811,986 | 421 |
| 41 | Food Retailing | 808,031 | 107 |
| 03 | Forestry and Logging | withheld | withheld |
| 40 | Fuel Retailing | 9,829 | 57 |
| 25 | Furniture and Other Manufacturing | 11,608 | 30 |
| 92 | Gambling Activities | withheld | withheld |
| 27 | Gas Supply | 2,277,477 | 58 |
| 36 | Grocery, Liquor and Tobacco Product Wholesaling | 61,968 | 210 |
| 31 | Heavy and Civil Engineering Construction | 356,221 | 147 |
| 89 | Heritage Activities | withheld | withheld |
| 84 | Hospitals | 162,990 | 342 |
| 63 | Insurance and Superannuation Funds | 3,521 | 41 |
| 57 | Internet Publishing and Broadcasting | withheld | withheld |
| 59 | Internet Service Providers, Web Search Portals and Data Processing Services | 3,541 | 53 |
| 60 | Library and Other Information Services | withheld | withheld |
| 24 | Machinery and Equipment Manufacturing | withheld | withheld |
| 34 | Machinery and Equipment Wholesaling | 18,190 | 29 |
| 85 | Medical and Other Health Care Services | 37,485 | 248 |
| 08 | Metal Ore Mining | 11,358,788 | 226 |
| 55 | Motion Picture and Sound Recording Activities | withheld | withheld |
| 39 | Motor Vehicle and Motor Vehicle Parts Retailing | 20,765 | 38 |
| 35 | Motor Vehicle and Motor Vehicle Parts Wholesaling | withheld | withheld |
| - | No ANZSIC code reported | withheld | withheld |
| 09 | Non-Metallic Mineral Mining and Quarrying | 545,900 | 101 |
| 20 | Non-Metallic Mineral Product Manufacturing | 8,180,159 | 215 |
| 43 | Non-Store Retailing and Retail Commission-Based Buying and/or Selling | withheld | withheld |
| 07 | Oil and Gas Extraction | 23,887,564 | 216 |
| 37 | Other Goods Wholesaling | withheld | withheld |
| 42 | Other Store-Based Retailing | 43,936 | 208 |
| 50 | Other Transport | 474,803 | 32 |
| 95 | Personal and Other Services | 67,189 | 63 |
| 17 | Petroleum and Coal Product Manufacturing | 6,473,446 | 59 |
| 19 | Polymer Product and Rubber Product Manufacturing | 19,409 | 61 |
| 51 | Postal and Courier Pick-up and Delivery Services | 126,665 | 23 |
| 80 | Preschool and School Education | withheld | withheld |
| 21 | Primary Metal and Metal Product Manufacturing | 27,116,792 | 85 |
| 16 | Printing (including the Reproduction of Recorded Media) | 25,655 | 30 |
| 69 | Professional, Scientific and Technical Services (Except Computer System Design and Related Services) | 64,930 | 187 |
| 67 | Property Operators and Real Estate Services | 120,717 | 479 |
| 75 | Public Administration | withheld | withheld |
| 77 | Public Order, Safety and Regulatory Services | withheld | withheld |
| 54 | Publishing (except Internet and Music Publishing) | 6,289 | 26 |
| 15 | Pulp, Paper and Converted Paper Product Manufacturing | 1,150,816 | 75 |
| 47 | Rail Transport | 3,484,691 | 67 |
| 66 | Rental and Hiring Services (except Real Estate) | 16,905 | 19 |
| 94 | Repair and Maintenance | 10,409 | 51 |
| 86 | Residential Care Services | 14,572 | 32 |
| 46 | Road Transport | 3,956,648 | 553 |
| 87 | Social Assistance Services | withheld | withheld |
| 91 | Sports and Recreation Activities | 14,353 | 69 |
| 58 | Telecommunications Services | 76,156 | 157 |
| 81 | Tertiary Education | 144,073 | 156 |
| 13 | Textile, Leather, Clothing and Footwear Manufacturing | withheld | withheld |
| - | Totals of withheld items | 207,972 | 202 |
| 23 | Transport Equipment Manufacturing | 86,631 | 39 |
| 52 | Transport Support Services | 472,831 | 139 |
| 53 | Warehousing and Storage Services | 76,397 | 189 |
| 29 | Waste Collection, Treatment and Disposal Services | 3,034,937 | 256 |
| 28 | Water Supply, Sewerage and Drainage Services | 679,663 | 184 |
| 48 | Water Transport | 877,335 | 82 |
| 14 | Wood Product Manufacturing | 218,480 | 76 |